
Page 171 - PhD GT
P. 171
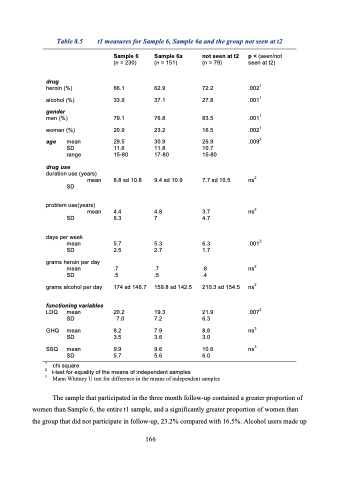
Table 8.5
t1 measures for Sample 6, Sample 6a and the group not seen at t2
     drug
heroin (%)
alcohol (%)
gender
men (%)
women (%)
age mean SD
range
drug use
duration use (years) mean
SD
problem use(years) mean
SD
days per week mean
SD
grams heroin per day mean
SD
grams alcohol per day
functioning variables
LDQ mean SD
GHQ mean SD
SSQ mean SD
Sample 6
(n = 230)
66.1 33.9
79.1 20.9
29.5 11.6 15-80
8.8 sd 10.8
4.4 6.3
5.7 2.5
.7 .5
174 sd 146.7
20.2 7.0
8.2 3.5
9.9 5.7
Sample 6a
(n = 151)
62.9 37.1
76.8 23.2
30.9 11.8 17-80
9.4 sd 10.9
4.8 7
5.3 2.7
.7 .5
159.8 sd 142.5
19.3 7.2
7.9 3.6
9.6 5.6
not seen at t2
(n = 79)
72.2 27.8
83.5 16.5
26.9 10.7 15-80
7.7 sd 10.5
3.7 4.7
6.3 1.7
.8 .4
210.3 sd 154.5
21.9 6.3
8.8 3.0
10.6 6.0
p < (seen/not seen at t2)
.0021 .0011
.0011 .0021 .0092
ns2
ns2
.0012
ns2 ns2
.0073 ns3 ns3
1 2 3
chi square
t-test for equality of the means of independent samples
     Mann Whitney U test for difference in the means of independent samples
The sample that participated in the three month follow-up contained a greater proportion of women than Sample 6, the entire t1 sample, and a significantly greater proportion of women than the group that did not participate in follow-up, 23.2% compared with 16.5%. Alcohol users made up
166
