
Page 173 - PhD GT
P. 173
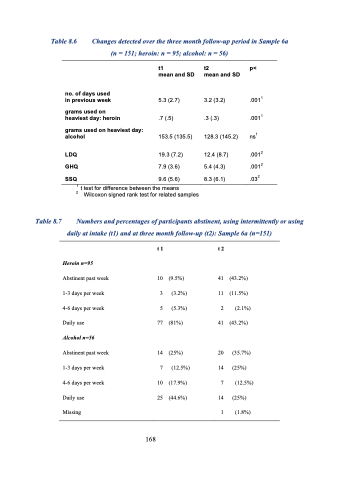
Table 8.6 Changes detected over the three month follow-up period in Sample 6a (n = 151; heroin: n = 95; alcohol: n = 56)
    no. of days used in previous week
grams used on heaviest day: heroin
grams used on heaviest day: alcohol
LDQ
GHQ
SSQ
3.2 (3.2)
.3 (.3)
128.3 (145.2)
12.4 (8.7) 5.4 (4.3) 8.3 (6.1)
.0011 .0011 ns1
.0012 .0012 .032
1 t test for difference between the means
2 Wilcoxon signed rank test for related samples
t1
mean and SD
5.3 (2.7)
.7 (.5)
153.5 (135.5)
19.3 (7.2) 7.9 (3.6) 9.6 (5.6)
t2 p< mean and SD
    Table 8.7
Numbers and percentages of participants abstinent, using intermittently or using daily at intake (t1) and at three month follow-up (t2): Sample 6a (n=151)
   Heroin n=95
Abstinent past week 1-3 days per week 4-6 days per week Daily use
Alcohol n=56
10 (9.5%) 3 (3.2%) 5 (5.3%)
77 (81%)
41 11 2 41
20 14 7 14 Missing 1
(43.2%) (11.5%)
(2.1%) (43.2%)
(35.7%) (25%)
(12.5%) (25%)
(1.8%)
Abstinent past week 1-3 days per week 4-6 days per week Daily use
14 (25%)
7 (12.5%)
t1 t2
10 (17.9%) 25 (44.6%)
   168
