
Page 179 - PhD GT
P. 179
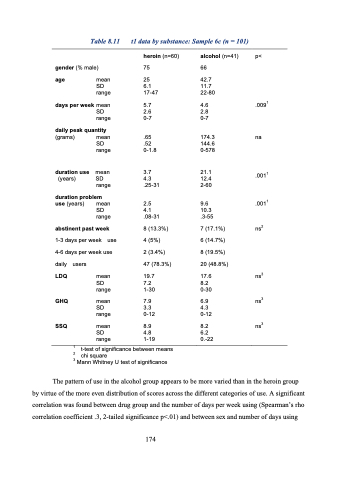
Table 8.11
t1 data by substance: Sample 6c (n = 101)
    gender (% male)
age mean SD
range
days per week mean SD
range
daily peak quantity
(grams) mean SD
range
mean SD range
heroin (n=60)
75
25 6.1 17-47
5.7 2.6 0-7
.65 .52 0-1.8
3.7 4.3 .25-31
2.5 4.1 .08-31
8 (13.3%) 4 (5%)
2 (3.4%) 47 (78.3%) 19.7
7.2 1-30
7.9 3.3 0-12
8.9 4.8 1-19
alcohol (n=41)
66
42.7 11.7 22-80
4.6 2.8 0-7
174.3 144.6 0-578
21.1 12.4 2-60
9.6 10.3 .3-55
7 (17.1%) 6 (14.7%) 8 (19.5%) 20 (48.8%) 17.6
8.2 0-30
6.9 4.3 0-12
8.2 6.2 0.-22
p<
.0091
na
1
.0011 ns2
ns3 ns3 ns3
    duration use
(years)
.001
 duration problem use (years) mean
SD range
abstinent past week
1-3 days per week use 4-6 days per week use daily users
LDQ
 GHQ SSQ
1 2
mean SD range
mean SD range
mean SD range
     means 3 Mann Whitney U test of significance
t-test of significance between
chi square
The pattern of use in the alcohol group appears to be more varied than in the heroin group by virtue of the more even distribution of scores across the different categories of use. A significant correlation was found between drug group and the number of days per week using (Spearman’s rho correlation coefficient .3, 2-tailed significance p<.01) and between sex and number of days using
174
