
Page 177 - PhD GT
P. 177
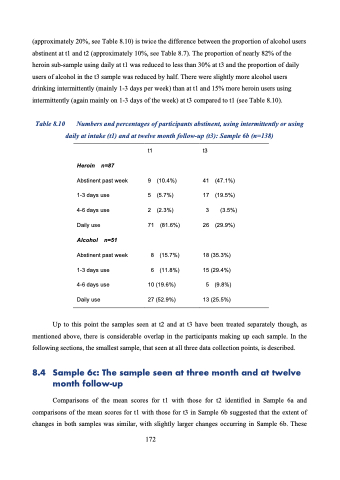
(approximately 20%, see Table 8.10) is twice the difference between the proportion of alcohol users abstinent at t1 and t2 (approximately 10%, see Table 8.7). The proportion of nearly 82% of the heroin sub-sample using daily at t1 was reduced to less than 30% at t3 and the proportion of daily users of alcohol in the t3 sample was reduced by half. There were slightly more alcohol users drinking intermittently (mainly 1-3 days per week) than at t1 and 15% more heroin users using intermittently (again mainly on 1-3 days of the week) at t3 compared to t1 (see Table 8.10).
Table 8.10
Numbers and percentages of participants abstinent, using intermittently or using daily at intake (t1) and at twelve month follow-up (t3): Sample 6b (n=138)
   Heroin n=87
Abstinent past week 1-3 days use
4-6 days use
Daily use
Alcohol n=51
Abstinent past week 1-3 days use
4-6 days use
Daily use
9 (10.4%) 5 (5.7%)
2 (2.3%) 71 (81.6%)
8 (15.7%)
6 (11.8%) 10 (19.6%) 27 (52.9%)
41 (47.1%) 17 (19.5%)
3 (3.5%) 26 (29.9%)
18 (35.3%) 15 (29.4%) 5 (9.8%) 13 (25.5%)
t1 t3
   Up to this point the samples seen at t2 and at t3 have been treated separately though, as mentioned above, there is considerable overlap in the participants making up each sample. In the following sections, the smallest sample, that seen at all three data collection points, is described.
8.4 Sample 6c: The sample seen at three month and at twelve month follow-up
Comparisons of the mean scores for t1 with those for t2 identified in Sample 6a and comparisons of the mean scores for t1 with those for t3 in Sample 6b suggested that the extent of changes in both samples was similar, with slightly larger changes occurring in Sample 6b. These
172
