
Page 189 - PhD GT
P. 189
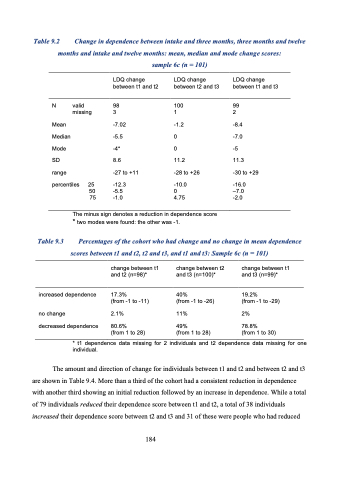
Table 9.2 Change in dependence between intake and three months, three months and twelve months and intake and twelve months: mean, median and mode change scores:
Table 9.3
Percentages of the cohort who had change and no change in mean dependence scores between t1 and t2, t2 and t3, and t1 and t3: Sample 6c (n = 101)
sample 6c (n = 101)
        N valid missing
LDQ change between t1 and t2
98 3
-7.02
-5.5
-4*
8.6
-27 to +11 -12.3
-5.5 -1.0
LDQ change between t2 and t3
100 1
-1.2
0
0
11.2
-28 to +26 -10.0
0 4.75
LDQ change between t1 and t3
99 2
-8.4
-7.0
-5
11.3
-30 to +29 -16.0
–7.0 -2.0
Mean Median Mode
SD
range percentiles
25 50 75
    The minus sign
* two modes were found: the other was -1.
denotes a reduction in dependence score
        increased dependence
no change
decreased dependence
change between t1 and t2 (n=98)*
17.3%
(from -1 to -11)
2.1%
80.6%
(from 1 to 28)
change between t2 and t3 (n=100)*
40%
(from -1 to -26)
11%
49%
(from 1 to 28)
change between t1 and t3 (n=99)*
19.2%
(from -1 to -29)
2%
78.8%
(from 1 to 30)
    * t1 dependence data missing for 2 individuals and t2 dependence data missing for one individual.
The amount and direction of change for individuals between t1 and t2 and between t2 and t3 are shown in Table 9.4. More than a third of the cohort had a consistent reduction in dependence with another third showing an initial reduction followed by an increase in dependence. While a total of 79 individuals reduced their dependence score between t1 and t2, a total of 38 individuals increased their dependence score between t2 and t3 and 31 of these were people who had reduced
184
