
Page 190 - PhD GT
P. 190
their dependence score between t1 and t2.
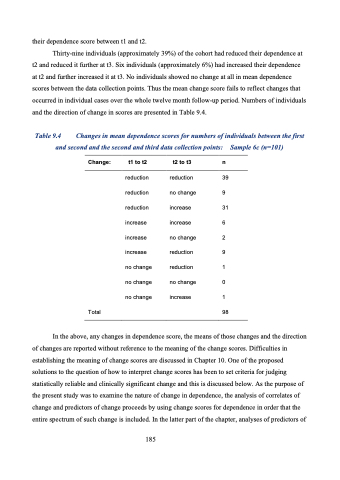
Thirty-nine individuals (approximately 39%) of the cohort had reduced their dependence at
t2 and reduced it further at t3. Six individuals (approximately 6%) had increased their dependence at t2 and further increased it at t3. No individuals showed no change at all in mean dependence scores between the data collection points. Thus the mean change score fails to reflect changes that occurred in individual cases over the whole twelve month follow-up period. Numbers of individuals and the direction of change in scores are presented in Table 9.4.
Table 9.4 Changes in mean dependence scores for numbers of individuals between the first
and second and the second and third data collection points:
Sample 6c (n=101)
Change:
t1 to t2
reduction reduction reduction increase increase increase no change no change no change
t2 to t3 n
reduction 39 no change 9 increase 31 increase 6 no change 2 reduction 9 reduction 1 no change 0 increase 1
98
T otal
In the above, any changes in dependence score, the means of those changes and the direction of changes are reported without reference to the meaning of the change scores. Difficulties in establishing the meaning of change scores are discussed in Chapter 10. One of the proposed solutions to the question of how to interpret change scores has been to set criteria for judging statistically reliable and clinically significant change and this is discussed below. As the purpose of the present study was to examine the nature of change in dependence, the analysis of correlates of change and predictors of change proceeds by using change scores for dependence in order that the entire spectrum of such change is included. In the latter part of the chapter, analyses of predictors of
185
