
Page 200 - PhD GT
P. 200
number and amount of variance accounted for by them. Additionally, in the present study the sample was of insufficient size to produce the subject item ratio of ten to one recommended by Nunnally (1978 p. 421) for factor analysis.
In view of the above, the composite scale was used as a whole and separate inventories of cognitive and behavioural coping (see Appendix 12) based upon the meaning of the items were used for the purpose of examining the main study hypotheses relating to the relationship between dependence and coping. The correlation between cognitive and behavioural coping was examined and a ratio of cognitive to behavioural coping was computed.
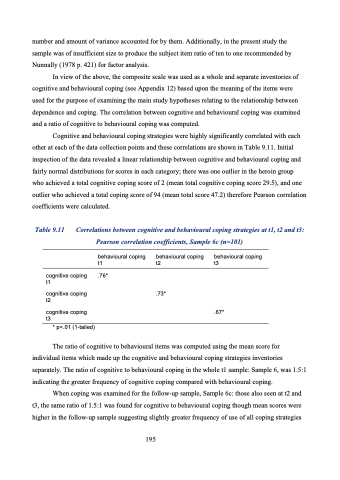
Cognitive and behavioural coping strategies were highly significantly correlated with each other at each of the data collection points and these correlations are shown in Table 9.11. Initial inspection of the data revealed a linear relationship between cognitive and behavioural coping and fairly normal distributions for scores in each category; there was one outlier in the heroin group who achieved a total cognitive coping score of 2 (mean total cognitive coping score 29.5), and one outlier who achieved a total coping score of 94 (mean total score 47.2) therefore Pearson correlation coefficients were calculated.
Table 9.11 Correlations between cognitive and behavioural coping strategies at t1, t2 and t3: Pearson correlation coefficients, Sample 6c (n=101)
behavioural coping behavioural coping behavioural coping t1 t2 t3
cognitive coping t1
cognitive coping t2
cognitive coping t3
* p<.01 (1-tailed)
.76*
.73*
.67*
The ratio of cognitive to behavioural items was computed using the mean score for individual items which made up the cognitive and behavioural coping strategies inventories separately. The ratio of cognitive to behavioural coping in the whole t1 sample: Sample 6, was 1.5:1 indicating the greater frequency of cognitive coping compared with behavioural coping.
When coping was examined for the follow-up sample, Sample 6c: those also seen at t2 and t3, the same ratio of 1.5:1 was found for cognitive to behavioural coping though mean scores were higher in the follow-up sample suggesting slightly greater frequency of use of all coping strategies
195
