
Page 201 - PhD GT
P. 201
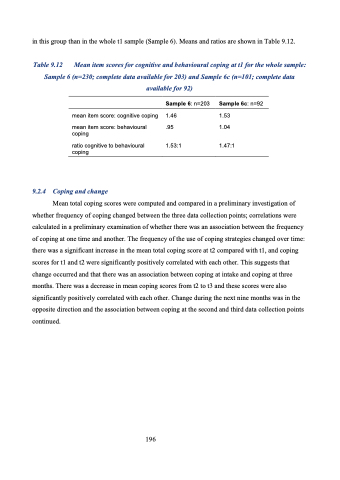
in this group than in the whole t1 sample (Sample 6). Means and ratios are shown in Table 9.12.
Table 9.12 Mean item scores for cognitive and behavioural coping at t1 for the whole sample: Sample 6 (n=230; complete data available for 203) and Sample 6c (n=101; complete data available for 92)
      mean item score: cognitive coping
mean item score: behavioural coping
ratio cognitive to behavioural coping
9.2.4 Coping and change
Sample 6: n=203 1.46
.95
1.53:1
Sample 6c: n=92 1.53
1.04
1.47:1
  Mean total coping scores were computed and compared in a preliminary investigation of whether frequency of coping changed between the three data collection points; correlations were calculated in a preliminary examination of whether there was an association between the frequency of coping at one time and another. The frequency of the use of coping strategies changed over time: there was a significant increase in the mean total coping score at t2 compared with t1, and coping scores for t1 and t2 were significantly positively correlated with each other. This suggests that change occurred and that there was an association between coping at intake and coping at three months. There was a decrease in mean coping scores from t2 to t3 and these scores were also significantly positively correlated with each other. Change during the next nine months was in the opposite direction and the association between coping at the second and third data collection points continued.
196
