
Page 206 - PhD GT
P. 206
9.2.7 Dependence and treatment
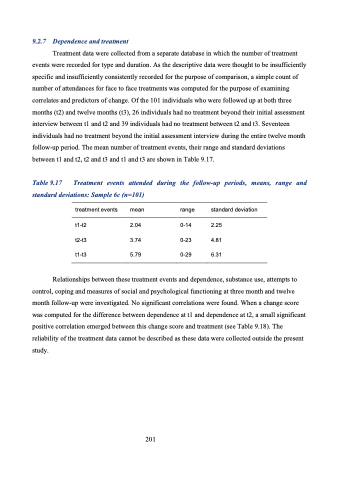
Treatment data were collected from a separate database in which the number of treatment events were recorded for type and duration. As the descriptive data were thought to be insufficiently specific and insufficiently consistently recorded for the purpose of comparison, a simple count of number of attendances for face to face treatments was computed for the purpose of examining correlates and predictors of change. Of the 101 individuals who were followed up at both three months (t2) and twelve months (t3), 26 individuals had no treatment beyond their initial assessment interview between t1 and t2 and 39 individuals had no treatment between t2 and t3. Seventeen individuals had no treatment beyond the initial assessment interview during the entire twelve month follow-up period. The mean number of treatment events, their range and standard deviations between t1 and t2, t2 and t3 and t1 and t3 are shown in Table 9.17.
Table9.17 Treatment events attended during the follow-up periods, means, range and standard deviations: Sample 6c (n=101)
treatment events mean t1-t2 2.04 t2-t3 3.74 t1-t3 5.79
range standard deviation 0-14 2.25
0-23 4.81
0-29 6.31
Relationships between these treatment events and dependence, substance use, attempts to control, coping and measures of social and psychological functioning at three month and twelve month follow-up were investigated. No significant correlations were found. When a change score was computed for the difference between dependence at t1 and dependence at t2, a small significant positive correlation emerged between this change score and treatment (see Table 9.18). The reliability of the treatment data cannot be described as these data were collected outside the present study.
201
