
Page 15 - Shreveport-Bossier Destination Master Plan 2023 Updated
P. 15
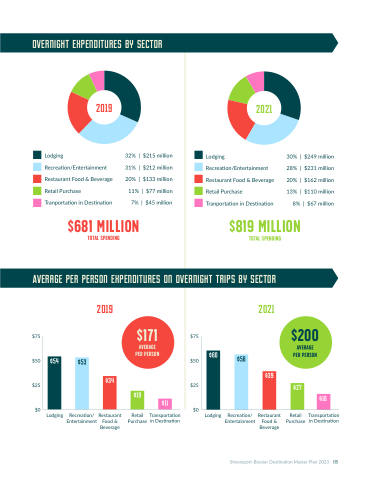
 overnight expenditures by sector
   2019
Lodging Recreation/Entertainment Restaurant Food & Beverage Retail Purchase Tranportation in Destination
32% | $215 million 31% | $212 million 20% | $133 million
11% | $77 million 7% | $45 million
2021
Lodging Recreation/Entertainment Restaurant Food & Beverage Retail Purchase Tranportation in Destination
30% | $249 million 28% | $231 million 20% | $162 million 13% | $110 million
8% | $67 million
          $75 $50 $25
$0
$171
average per person
Lodging Recreation/ Restaurant Retail Transportation Entertainment Food & Purchase in Destination
Beverage
$75 $200 average
$54
$681 Million Total spending
$819 Million Total spending
 Average per person expenditures on overnight trips by sector
2019 2021
    $50 $25 $0
per person
Lodging Recreation/ Restaurant Retail Transportation Entertainment Food & Purchase in Destination
Beverage
$60
 $56
  $53
 $34
$39
  $27
 $19
 $11
$16
    Shreveport-Bossier Destination Master Plan 2023 15
