Page 6 - Four Corners Community Bank
P. 6

Four Corners
                                                                             Four Corners
                                                                           Community Bank       Community
                Definition                                                  Farmington, NM         Bank
                                                                             September 30,    Farmington, NM
                                                                                 2017          September 30,
                                                                                                   2016
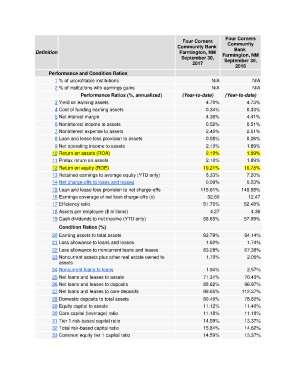
                          Performance and Condition Ratios
                        1  % of unprofitable institutions                                N/A              N/A
                        2  % of institutions with earnings gains                         N/A              N/A
                                                  Performance Ratios (%, annualized)   (Year-to-date)   (Year-to-date)
                        3  Yield on earning assets                                     4.70%            4.73%
                        4  Cost of funding earning assets                              0.34%            0.33%
                        5  Net interest margin                                         4.36%            4.41%
                        6  Noninterest income to assets                                0.52%            0.51%
                        7  Noninterest expense to assets                               2.45%            2.51%
                        8  Loan and lease loss provision to assets                     0.08%            0.26%
                        9  Net operating income to assets                              2.10%            1.89%
                       10   Return on assets (ROA)                                     2.10%            1.89%
                       11   Pretax return on assets                                    2.10%            1.89%
                       12   Return on equity (ROE)                                    19.21%           16.78%
                       13   Retained earnings to average equity (YTD only)             8.33%            7.20%
                                                                                       0.09%            0.23%
                       14   Net charge-offs to loans and leases
                       15   Loan and lease loss provision to net charge-offs         115.61%          148.88%
                       16   Earnings coverage of net loan charge-offs (x)               32.60            12.47
                       17   Efficiency ratio                                          51.70%           52.48%
                       18   Assets per employee ($ millions)                             4.27             4.36
                       19   Cash dividends to net income (YTD only)                   56.65%           57.09%
                          Condition Ratios (%)
                       20   Earning assets to total assets                            93.79%           94.14%
                       21   Loss allowance to loans and leases                         1.62%            1.74%
                       22   Loss allowance to noncurrent loans and leases             83.28%           67.38%
                       23   Noncurrent assets plus other real estate owned to          1.70%            2.05%
                          assets
                                                                                       1.94%            2.57%
                       24   Noncurrent loans to loans
                       25   Net loans and leases to assets                            71.31%           76.43%
                       26   Net loans and leases to deposits                          88.62%           96.97%
                       27   Net loans and leases to core deposits                     99.65%          112.37%
                       28   Domestic deposits to total assets                         80.46%           78.82%
                       29   Equity capital to assets                                  11.12%           11.40%
                       30   Core capital (leverage) ratio                             11.18%           11.18%
                       31   Tier 1 risk-based capital ratio                           14.59%           13.37%
                       32   Total risk-based capital ratio                            15.84%           14.62%
                       33   Common equity tier 1 capital ratio                        14.59%           13.37%
   1   2   3   4   5   6   7   8