Page 43 - Science Coursebook
P. 43

2  End of unit questions


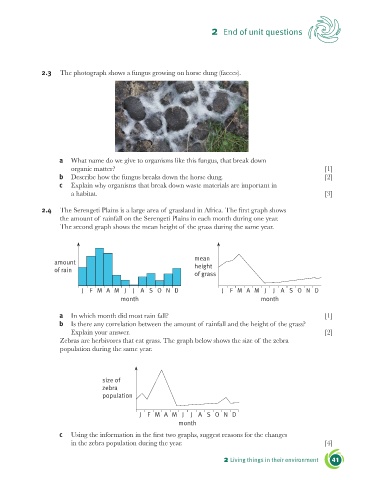
                2.3   The photograph shows a fungus growing on horse dung (faeces).


                      a   What name do we give to organisms like this fungus, that break down
                          organic matter?                                                                    [1]
                      b   Describe how the fungus breaks down the horse dung.                                [2]
                      c   Explain why organisms that break down waste materials are important in
                          a habitat.                                                                         [3]

                2.4   The Serengeti Plains is a large area of grassland in Africa. The first graph shows
                      the amount of rainfall on the Serengeti Plains in each month during one year.
                      The second graph shows the mean height of the grass during the same year.


                                                                  mean
                    amount
                    of rain                                       height
                                                                  of grass

                             J F M A M J      J A S O N D                  J F M A M J      J A S O N D
                                          month                                         month

                      a   In which month did most rain fall?                                                 [1]
                      b   Is there any correlation between the amount of rainfall and the height of the grass?
                          Explain your answer.                                                               [2]
                      Zebras are herbivores that eat grass. The graph below shows the size of the zebra
                      population during the same year.


                                    size of
                                    zebra
                                    population


                                                J F M A M J      J A S O N D
                                                             month

                      c   Using the information in the first two graphs, suggest reasons for the changes
                          in the zebra population during the year.                                           [4]


                                                                            2 Living things in their environment  41
   38   39   40   41   42   43   44   45   46   47   48