
Page 16 - Exam-3rd-2023-Jun
P. 16
No . 25
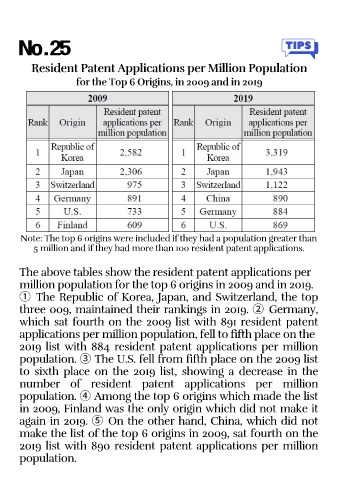
Resident Patent Applications per Million Population
for the Top 6 Origins, in 2009 and in 2019
Note: The top 6 origins were included if they had a population greater than
5 million and if they had more than 100 resident patent applications.
The above tables show the resident patent applications per
million population for the top 6 origins in 2009 and in 2019.
① The Republic of Korea, Japan, and Switzerland, the top
three 009, maintained their rankings in 2019. ② Germany,
which sat fourth on the 2009 list with 891 resident patent
applications per million population, fell to fifth place on the
2019 list with 884 resident patent applications per million
population. ③ The U.S. fell from fifth place on the 2009 list
to sixth place on the 2019 list, showing a decrease in the
number of resident patent applications per million
population. ④ Among the top 6 origins which made the list
in 2009, Finland was the only origin which did not make it
again in 2019. ⑤ On the other hand, China, which did not
make the list of the top 6 origins in 2009, sat fourth on the
2019 list with 890 resident patent applications per million
population.