
Page 91 - Tata Steel One Report 2024-Eng-Ebook HY
P. 91
Business Operation and Performance Driving Business Towards Sustainability Corporate Governance Policy Financial Statements Attachments
Content
UOM
FY25
FY24
FY23
FY22
FY21
FY20
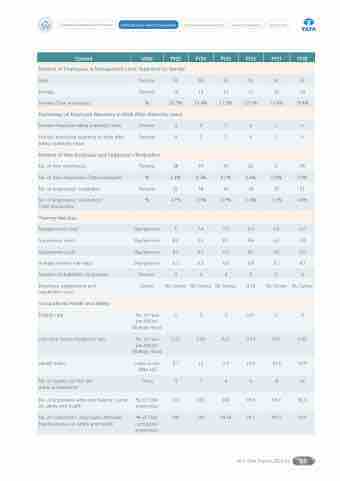
Number of Employees in Management Level Separated by Gender
Male
Persons
51
54
53
59
61
62
Female
Persons
13
13
11
11
12
14
Female/Total employees
%
20.3%
19.4%
17.2%
15.7%
16.4%
18.4%
Percentage of Employee Returning to Work After Maternity Leave
Female employee taking maternity leave
Persons
4
3
3
6
1
6
Female employee returning to work after taking maternity leave
Persons
4
2
3
6
1
6
Number of New Employee and Employee’s Resignation
No. of new employees
Persons
68
49
44
26
2
35
No. of new employees/Total employees
%
6.4%
4.5%
4.1%
2.4%
0.2%
3.0%
No. of employees’ resignation
Persons
51
38
30
18
23
51
No. of employees’ resignation/ Total employees
%
4.7%
3.5%
2.7%
1.6%
2.1%
4.4%
Training Man-Day
Management Level
Day/persons
5
7.4
7.9
9.0
6.0
6.0
Supervisory Level
Day/persons
8.4
9.5
8.7
9.8
6.0
5.8
Operational Level
Day/persons
4.9
4.6
6.0
4.6
4.2
3.0
Average training man-days
Day/persons
6.1
6.5
6.6
6.8
5.1
4.3
Number of disabilities employees
Persons
4
4
4
4
4
4
Employee engagement and satisfaction score
Scores
No Survey
No Survey
No Survey
4.10
No Survey
No Survey
Occupational Health and Safety
Fatality rate
No. of case
per Million Working Hours
0
0
0
0.21
0
0
Lost time injuries frequency rate
No. of case
per Million Working Hours
0.21
0.20
0.21
0.63
0.21
0.00
Health Index
Index Score (Max 16)
9.7
10
9.9
10.0
10.5
10.9
No. of injuries got first aid/ medical treatment
Times
4
7
6
6
8
16
No. of employees attended training course on safety and health
% of Total employees
100
100
100
99.9
99.7
82.9
No. of contractors’ employees attended training course on safety and health
% of Total contractors’ employees
100
100
99.69
99.1
89.3
94.9
56-1 One Report 2024-25 89
