
Page 66 - PSTC - One Report 2023 (EN)
P. 66
Other Current Assets
Other current assets as of December 31, 2023, decreased by 65.7 million baht from the previous year, mainly due to a decrease in cash balances.
Investments in Joint Ventures
Investments in joint ventures refer to investments in Thai Pipeline Network Company Limited. Investments in joint ventures as of December 31, 2023, increased from the previous year by 237.0 million baht due to the joint venture having realized gains from fair value measurement of derivative instruments (interest rate and exchange rate swap contracts) posted to other comprehensive income.
Land, Buildings, and Equipment
Land, buildings, and equipment as of December 31, 2023, decreased from the previous year in the amount of 101.25 million baht. The main attributions are from the sale of land and office buildings and depreciation during the year.
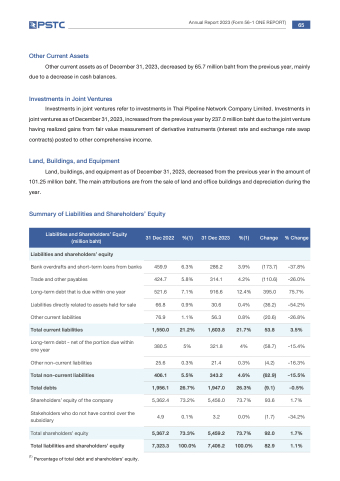
Summary of Liabilities and Shareholders’ Equity
Annual Report 2023 (Form 56-1 ONE REPORT)
65
Liabilities and Shareholders’ Equity (million baht)
31 Dec 2022
%(1)
31 Dec 2023
%(1)
Change
% Change
Liabilities and shareholders’ equity
Bank overdrafts and short-term loans from banks Trade and other payables
Long-term debt that is due within one year Liabilities directly related to assets held for sale Other current liabilities
Long-term debt - net of the portion due within one year
Other non-current liabilities
Shareholders’ equity of the company
Stakeholders who do not have control over the subsidiary
Total liabilities and shareholders’ equity
459.9 6.3% 286.2 3.9% (173.7)
424.7 5.8% 314.1 4.2% (110.6)
521.6 7.1% 916.6 12.4% 395.0
66.8 0.9% 30.6 0.4% (36.2)
76.9 1.1% 56.3 0.8% (20.6) 380.5 5% 321.8 4% (58.7)
25.6 0.3% 21.4 0.3% (4.2)
5,362.4 73.2% 5,456.0 73.7% 93.6
4.9 0.1% 3.2 0.0% (1.7)
-37.8%
-26.0%
75.7%
-54.2%
-26.8% -15.4%
-16.3%
1.7%
-34.2%
Total current liabilities
1,550.0
21.2%
1,603.8
21.7%
53.8
3.5%
Total non-current liabilities
406.1
5.5%
343.2
4.6%
(62.9)
-15.5%
Total debts
1,956.1
26.7%
1,947.0
26.3%
(9.1)
-0.5%
Total shareholders’ equity
(1) Percentage of total debt and shareholders’ equity.
5,367.2
73.3%
5,459.2
73.7%
92.0
1.7%
7,323.3
100.0%
7,406.2
100.0%
82.9
1.1%
