
Page 3 - RosboroAR2020
P. 3
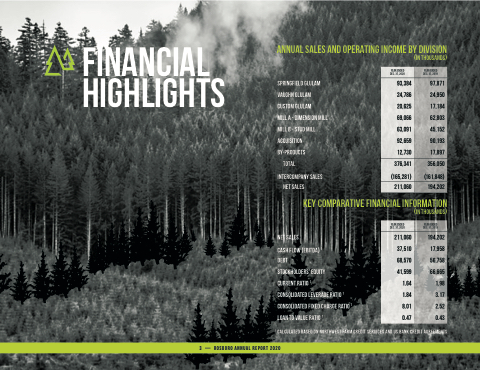
Financial HIGHLIGHTS
ANNUAL SALES AND OPERATING INCOME BY DIVISION (IN THOUSANDS)
3 — ROSBORO ANNUAL REPORT 2020
Springfield Glulam Vaughn Glulam Custom Glulam
Mill A - Dimension Mill Mill B - Stud Mill Acquisition By-Products
total
Intercompany Sales Net Sales
YEAR ENDED Dec. 31, 2020
93,384 24,786 20,625 69,066 63,091 92,659 12,730
376,341
(165,281) 211,060
YEAR ENDED Dec. 31, 2019
97,871 24,950 17,184 62,803 45,152 90,193 17,897
356,050
(161,848) 194,202
Net Sales
KEY COMPARATIVE FINANCIAL INFORMATION (IN THOUSANDS)
211,060 37,510 Debt 68,570
Cash Flow (EBITDA) 1 Stockholders' Equity
Current Ratio 1
Consolidated Leverage Ratio 1 Consolidated Fixed Charge Ratio 1 Loan to Value Ratio 1
1 Calculated based on Northwest Farm Credit Services and US Bank Credit Agreements.
YEAR ENDED Dec. 31, 2019
194,202 17,958 56,758
41,599 66,665 1.64 1.98 1.84 3.17 8.01 2.52 0.47 0.43
YEAR ENDED Dec. 31, 2020
