
Page 4 - RosboroAR2018
P. 4
To keep pace with the needs of our growing glulam customer base, in 2018 Rosboro added critical sta in Engineering, Inside Sales, and Marketing – all of which had an immediate and positive impact on the business.
FINANCIAL HIGHLIGHTS
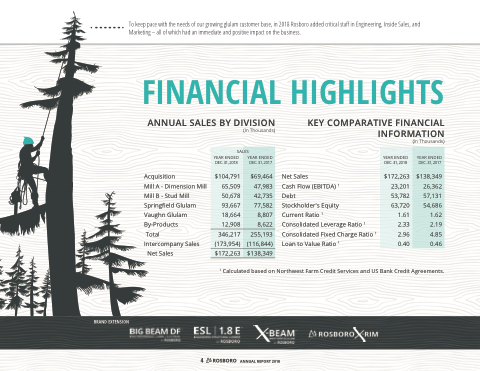
ANNUAL SALES BY DIVISION
KEY COMPARATIVE FINANCIAL INFORMATION
(In Thousands)
Net Sales
Cash Flow (EBITDA) 1
Debt
Stockholder's Equity
Current Ratio 1
Consolidated Leverage Ratio 1 Consolidated Fixed Charge Ratio 1 Loan to Value Ratio 1
1 Calculated based on Northwest Farm Credit Services and US Bank Credit Agreements.
(In Thousands)
YEAR ENDED DEC. 31, 2018
$104,791 65,509 50,678 93,667 18,664 12,908
YEAR ENDED DEC. 31, 2017
$69,464 47,983 42,735 77,582
8,807 8,622
SALES
346,217 (173,954)
255,193 (116,844)
$172,263
$138,349
YEAR ENDED DEC. 31, 2018
$172,263 23,201 53,782 63,720 1.61 2.33 2.96 0.40
YEAR ENDED DEC. 31, 2017
$138,349 26,362 57,131 54,686 1.62 2.19 4.85 0.46
Acquisition
Mill A - Dimension Mill Mill B - Stud Mill Spring eld Glulam Vaughn Glulam By-Products
Total Intercompany Sales
Net Sales
BRAND EXTENSION
4 ANNUAL REPORT 2018
