
Page 26 - Performance of Graduates in Licensure Examination Narrative Report
P. 26
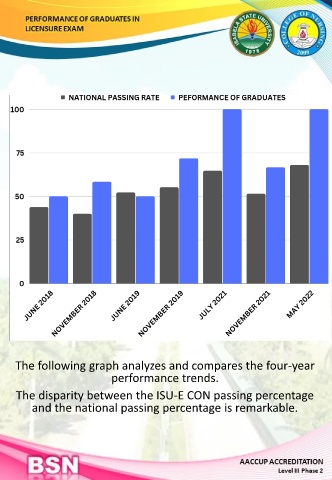
The following graph analyzes and compares the four-year

                                     performance trends.

      The disparity between the ISU-E CON passing percentage

           and the national passing percentage is remarkable.