
Page 41 - May-June 2018 GSE Report Flip Book
P. 41
FANNIE MAE AND FREDDIE MAC MAJAYN-UAJRUYNE20210818
supply, and strong home price appreciation, which have drastically reduced refinance activity and restrained home purchase affordability,” said Doug Duncan, SVP and chief economist at Fannie Mae. “These factors have combined to squeeze mortgage origination volumes and have increased competitive pressures. Increased competitiveness will likely persist as a top driver of lenders’ mortgage business strategy. We expect this will prompt businesses to turn to cost-cutting as a means of managing their bottom lines, with payroll reduction likely to assume a more prominent role in future belt-tightening efforts.” (Press Release, Fannie Mae, 06/12/18)
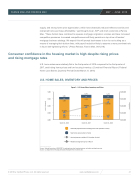
Consumer confidence in the housing market is high despite rising prices and rising mortgage rates
U.S. home sales were relatively flat in the first quarter of 2018 compared to the first quarter of 2017, amid rising home prices and low housing inventory. (Combined Financial Report, Federal Home Loan Banks, Quarterly Period Ended March 31, 2018)
Conditions in U.S. Housing Markets. Conditions in the U.S. housing markets primarily affect the FHLBanks through the creation of demand for, and yield on, advances and mortgage loans, as well as the yield on investments in mortgage-backed Use.cSur.itiHes.OU.MS. hEomSe sAalLesEwSere, rIeNlatViveElyNflaTt iOn tRheYfirsAt qNuaDrterPoRf 2I0C18EcoSmpared to the first quarter of 2017, amid rising
home prices and low housing inventory.
7,000
5,500
4,000
2,500
1,000
____________________
Figure 1: U.S. Home Sales, Inventory, and Prices
6,342
6,294
$280,000
$260,000
$240,000
$220,000
$200,000
5,891
March 31, 2016
March 31, 2017
March 31, 2018
Seasonally adjusted annual existing home sales (number of units) New home sales (number of units)
Housing inventory at March 31 (number of units)
Median existing home price in March
Source: National Association of REALTORS® for existing home sales, housing inventory, and median existing home price. Source: U.S. Department of Housing and Urban Development for new home sales.
642
694
531
5,700
$236,600
1,800
5,600
$250,400
1,670
5,360
$221,400
1,960
Interest Rate Levels and Volatility. The level and volatility of interest rates affect FHLBank member demand for advances. In addition, credit spreads and the shape of the yield curve affect investor demand for consolidated obligations. These factors also impact the FHLBanks' combined results of operations, primarily affecting net interest income and the valuation of certain assets and liabilities.
Interest rates, volatility, and spreads were affected by several factors during the three months ended March 31, 2018. In the United States, overall economic conditions, monetary policy, financial regulation, and high levels of corporate debt issuance all continued to be influencing factors. Table 1 presents key interest rate data that illustrates the increases in interest rates during
the three months ended March 31, 2018, compared to the same period in 2017.
© 2018 by Canfield Press, LLC. All rights reserved. www.canfieldpress.com 41
units in thousands
whole dollars
