
Page 42 - May-June 2018 GSE Report Flip Book
P. 42
FANNIE MAE AND FREDDIE MAC MAJAYN-UAJRUYNE20210818
re Home Prices Overvalued?
y Frank E. Nothaft
ome prices have risen in nearly all parts
f the nation over the last few years. While rice gains vary considerably across urban
arkets, some places have had especially pid appreciation that put values above eir pre-Great Recession peak, even after
ontrolling for inflation. With prices setting ew records, it’s natural to wonder whether
e housing market is on the verge of nother valuation bubble.
he CoreLogic Market Conditions Indicator rovides a gauge to identify urban areas
at may be overheating. The Indicator
based on straightforward intuition: ome prices should generally rise in line ith income growth of local residents. If
rices grow too fast, then homes are less ffordable and price growth should slow
hile incomes catch up.
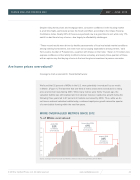
e found that 32 percent of MSAs in the U.S. ere potentially ‘overvalued’ by our metric i arch. (Figure 1) The last time that one-third
f metro areas were overvalued in a rising rice environment was Spring 2003. While
any metros were frothy 15 years ago, the aluation bubble was still localized and not ational; however, rapid price growth during
e following three years led to 67 percent f markets overvalued by 2006. Thus, while
e do not have a national valuation bubble
day, continued rapid price growth raises
e specter of a new bubble forming
Corelogic’s chief economist Dr. Frank Nothaft wrote:
Despite rising home prices and mortgage rates, consumer confidence in the housing market
is at all time highs, particularly across the South and West, according to the Chase Housing Confidence Index. Nearly 80% of those surveyed said now is a good time to sell, while only 17% said it’s a bad time to buy a home—due largely to affordability challenges.
“These record results were driven by healthy assessments of local real estate market conditions
among existing homeowners, but even more so by surging expectations among renters,” said
The MarketPulse g June 2018 g Volume 7, Issue 6 | Articles
express confidence in their ability to afford a home someday, and nearly three-quarters of those
Terry Loebs, founder of Pulsenomics, a partner with Chase on the Index. “Seven in 10 renters now
.S. Economic Outlook: June 2018
Are home prices overvalued?
with an opinion say that buying a home is the best long-term investment a person can make.
The CoreLogic Market Conditions Indicator
is an early warning signal for bubbly
We found that 32 percent of MSAs in the U.S. were potentially ‘overvalued’ by our metric
markets. It should be used in concert Dr. Frank Nothaft
in March. (Figure 1) The last time that one-third of metro areas were overvalued in a rising
with other metrics, such as a comparison Executive, Chief Economist, nothaft: fig 1
opfripcreicens vwiritohnlmoceanltrewnats, Stopdrientger2m0i0n3e.ifWhile many metros Oweffirceefrofththye1C5hyiefaErscoangom, tihste vallueastihoanvbeubebcleomweasunsteillthloecreadlizteodmanrkdent ot national; however, rapid price growth during the
Frank Nothaft holds the title executive, chief
f o l l o w i n g t h r e e y e a r s l e d t o 6 7 p e r c e n t o f m a r e k c e o t n s o m o i v s t e f o r v r Ca o l u r e e L d o g b i c y . H 2 e 0 l e 0 a 6 d . s T t h h e u O s f fi , c w e h o f i l e w e d o
fundamentals. And while it shows that the U.S. is not in a valuation bubble yet, there
the Chief Economist and is responsible for analysis,
not have a national valuation bubble today, coconmtimnuenetdaryrapndidfoprercicaestinggrotrewntdhs irnagilsoebasl rtehael specter
are many urban areas where prices appear
estate, insurance and mortgage markets.
of a new bubble forming within the next few years.
to have become delinked to their long-term relationship with income. ■
MORE OVERVALUED METROS SINCE 2012
FIGURE 1. MORE OVERVALUED METROS SINCE 2012
% of MSAs overvalued
Percent of MSAs Overvalued
70% 60% 50%
n 40%
30%
20%
10%
April 2003
32%
Of Metros Overvalued
November 2006
67%
Of Metros Overvalued
Source: Corelogic Home Price Index and Market Conditions Indicator through Marck 2018 for MSAs So0u%rce: CoreLogic Home Price Index and Market Conditions Indicator through March 2018 for MSAs
2000 2003 2006 2009 2012
2015 2018
March 2018
32%
Of Metros Overvalued
FIGURE 2: MOST OVERVALUED METROS NEAR SEACOASTS OR ROCKY MOUNTAINS
Market Conditions Indicator (MCI)
Pea 18.4
© 2018 by Canfield Press, LLC. All rights reserved.
www.canfieldpress.com
42
ithin the next few years.
hen viewed by location, most of today’s
U
A
H o p m
a
h c
n h%
a
p h
s h w p a w
W w M o p m
n h
o w o
h w
W
k
