
Page 44 - May-June 2018 GSE Report Flip Book
P. 44
FANNIE MAE AND FREDDIE MAC
MAJAYN-UAJRUYNE20210818
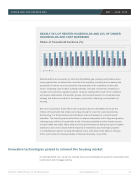
NEARLY 50% OF RENTER HOUSEHOLDS AND 25% OF OWNER HOUSEHOLDS ARE COST BURDENED
FIGURE 32
Share of household burdens (%)
Nearly Half of Renter Households and a Quarter of Owner Households Are Cost Burdened
Share of Households with Cost Burdens (Percent)
Notes: Cost-burdened households pay more than 30% of income for housing. Households with zero or negative income are assumed to have burdens, while households paying no cash rent are assumed to be without burdens.
Source: JCHS tabulations of US Census Bureau, American Community Survey 1-Year Estimates.
National efforts are necessary to close the affordability gap. Housing policymakers have many opportunities to address the cost side of the equation, including the increasing size
Cost-burdenedsharesarealsomuchhigheramongblack(45percent) quartile spent almost $650 less on non-housing expenses each and Hispanic households (43 percent) than among Asian and other month than bottom-quartile households that are not cost burdened.
and quality of homes; lack of productivity improvements in the residential construction
minority households (36 percent) or white households (27 percent). Severely cost-burdened families with children spent $190 less on
sEevcentoarm;oengschaoulasethionldgs cwoitshitnstohef lsambeorin,cbomueildgrionugpsm, largterrialsfo,odancodstslathnadn;uanbnudrdebnaedrrhioeurssehcolrdes a(Ftiegudreb34y).aSeverely bur-
shares of minorities than whites are cost burdened (Figure 33). The dened older households in the bottom expenditure quartile spent 70 complex and restrictive regulatory system. However, tackling this broad mix of conditions
cost-burdened rates for black and Hispanic households have also percent less each month on healthcare costs than otherwise similar
will require collaboration of the public, private, and nonprofit sectors in a comprehensive
increased more rapidly in recent years than for other groups, rising households without burdens.
3 percentage points in 2001–2016 compared with 1 percentage point
sftorrawtheitgeyhotuhseahtolfdossantedrasn eivnenosmvallteirounpticnk ftohreAsidaneasnidgont,hecronstruction, financing, and regulation of
minority households.
GEOGRAPHIC DISTRIBUTION OF COST BURDENS
In 2015–2016, the shares of cost-burdened households fell in 44
states across the country, as well as in 79 of the nation’s 100 most
populous metros. The declines were modest, with shares in 31 met-
ros decreasing by less than 1 percentage point, and largely driven by
housing.
TRADEOFFS BETWEEN HOUSING AND OTHER NECESSITIES
Households in the bottom income quartile saw their housing costs
But even if successful, these efforts will not produce decent, affordable homes for the
rise and their incomes fall between 2001 and 2016. As a result, moderate increases in incomes.
millions of households that simply cannot pay enough to cover the costs of producing
the amount they had left over each month to pay for other basic
needs declined from $730 to just $590 in real terms over this period. Despite a small decrease, the cost-burdened share of households in thInasthharopucsonintrgas.t,Fhourstehoeldsseinfathmeilhiieghsesatnqduaritnildeisvaiwduthaelirs,thCealrieforwniaillwaslwstially4s2 pbereceantnine2e01d6,fwoitrhprautebslincNew York and incomes climb significantly in 2001–2016 while their monthly hous- New Jersey nearly as high at 39 percent. These states are home to 17
subsidies. The federal government’s failure to respond adequately to this large and growing
ing costs increased only $20, leaving $10,600 each month for all of the 25 metros with the highest burden rates in the country. Los
other expenses. Angeles tops the list (47 percent), followed by Miami, Santa Barbara,
challenge puts millions of households at risk of housing instability and the threats it poses
and Atlantic City. Even in the most affordable states, such as Iowa, Lowest-income households with children are especially hard South Dakota, and West Virginia, more than a fifth of households
to basic health and safety. Many state and local governments are doing their part to expand
pressed, with just $490 to spend after paying for housing. By the were cost burdened.
aEscsonisomtaicnPcoleic,y bInusttituatem’s moeraesuroe,bfaumsiltiefsewditehrcahilldrrenstphoatnlisve is essential to any meaningful progress
in even the most affordable metros need at least $2,700 per month About a third of the households in metropolitan areas struggle to
in combatting the nation’s housing affordability crisis. (The State of the Nation’s Housing
to cover essential non-housing expenses. find affordable housing (Figure 35). The nation’s 10 largest metros
2018, Joint Center for Housing Studies of Harvard University, June 2018)
According to the latest Consumer Expenditure Survey, severely 2016, median housing costs in these areas exceeded $1,300 per
housing cost-burdened households in the bottom expenditure month while median monthly incomes were about $5,600, leaving
have the highest concentrations of cost-burdened households. In
60 50 40 30 20 10
0
2001 2002 2003 2004 2005 2006 2007 2008 2009 2010 2011 2012 2013 2014 2015 2016 ● Renters ● Owners
DELY COST BURDENED
all US households paid more than 30 percent of ousing in 2016. For renters alone, however, the is 47 percent (Figure 32). And of the 20.8 million ith burdens, some 11.0 million pay more than or housing and are severely burdened. Although rdened owners is considerably lower at 23 per- still total 17.3 million and include 7.5 million
.
ss, the overall number of cost-burdened house- illion between 2010 and 2016. Much of this ver, reflects a 3.8 million decline in the number wners with incomes above $45,000. With this wners with cost burdens fell from a peak of 30 3 percent in 2016—just under the share posted , the share of cost-burdened renters has hardly percent peak in 2011 and remains well above its
2001.
or rent, most low-income households pay out- ome for housing. Fully 80 percent of renters 0,000 were cost burdened in 2016, including 55 burdens. Owners earning less than $30,000 also rden rate of 63 percent, with 42 percent severely w-income owners with mortgages, a staggering
burdened.
types, single-parent families are the most likely . Indeed, more than half of these households (53 30 percent of income for housing, reflecting the earners and the need for larger units. By com- fifth (18 percent) of married households without
rdened.
to cost burdens. At one end of the spectrum, households under age 30 are cost burdened. holds have low incomes and are single-person ters. At the other end, 54 percent of households t rent and 43 percent of owners still paying off
ened as well.
JOINT CENTER FOR HOUSING STUDIES OF HARVARD UNIVERSITY 31 Innovative technologies poised to reinvent the housing market
On DisruptionHub.com, Laura Cox outlined how new technologies are poised to revoluntize home construction and mortgage lending:
© 2018 by Canfield Press, LLC. All rights reserved. www.canfieldpress.com 44
e w
u s s
m e
o 2
c 3
o
d
t e
u
f e
a
