
Page 61 - July-August 2018 GSE Report Flip Book
P. 61
FEDERAL HOME LOAN BANK JJUALN. U- ARUYG. 22001188
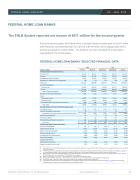
FEDERAL HOME LOAN BANKS The FHLB System reported net income of $971 million for the second quarter
During the second quarter, the Federal Home Loan Bank System’s assets grew 2% to $1.1 billion, while Advances increased less than 1% to $734.5 to $734.5 billion and mortgage loans held in portfolio increased 6% to $57.2 billion. The System’s net worth increased 5% to 58.4 billion, representing 5.17% of total assets.
FEDERAL HOME LOAN BANKS’ SELECTED FINANCIAL DATA
SELECTED FINANCIAL DATA
(dollars in millions) June 30,
2018 2017
March 31, December 31, September 30, June 30,
Selected Statement of Condition Data at
Investments(1) $ 332,710 $ 329,412 $ 307,280 $ 318,349 $ 312,548
Advances
734,457
697,066
731,544
719,387
706,849
Mortgage loans held for portfolio 57,225 54,915 53,843 52,226 50,555
Allowance for credit losses on mortgage loans
(16)
(17)
(16)
(16)
(17)
Total assets 1,130,235 1,087,860 1,103,451 1,097,509 1,081,699
Consolidated obligations
Discount notes 412,839 389,052 391,480 407,311 428,684
Bonds
644,421
627,837
641,601
620,706
582,248
Total consolidated obligations 1,057,260 1,016,889 1,033,081 1,028,017 1,010,932
Mandatorily redeemable capital stock
1,206
1,237
1,272
1,347
1,484
Capital
Total capital stock(2)
38,670
37,285
37,657
37,007
36,883
Retained earnings 18,914 18,463 18,099 17,681 17,238
Accumulated other comprehensive income (loss)
806
890
724
628
442
Total capital 58,390 56,638 56,480 55,316 54,563
Selected Statement of Income Data for the quarter ended
Net interest income $ 1,332 $ 1,265 $ 1,236 $ 1,236 $ 1,189
Provision (reversal) for credit losses
(1)
2
—
(1)
1
Net interest income after provision (reversal) for credit losses 1,333 1,263 1,236 1,237 1,188
Non-interest income (loss)
59
4
58
28
37
Non-interest expense 311 312 330 314 285
Affordable Housing Program Assessments
110
97
98
97
96
Net income $ 971 $ 858 $ 866 $ 854 $ 844
Selected Other Data for the quarter ended
Cash and stock dividends $ 520 $ 499 $ 448 $ 411 $ 394
Dividend payout ratio(3)
53.55%
58.16%
51.73%
48.13%
46.68%
Return on average equity(4)(5) 6.73% 6.01% 6.23% 6.19% 6.36%
Return on average assets
0.35%
0.30%
0.32%
0.31%
0.32%
Average equity to average assets(5) 5.20% 5.06% 5.07% 4.99% 5.03%
Net interest margin(6)
0.48%
0.45%
0.45%
0.45%
0.46%
Selected Other Data at
GAAP capital-to-asset ratio
5.17%
5.21%
5.12%
5.04%
5.04%
Regulatory capital-to-assets ratio(7) 5.20% 5.24% 5.17% 5.11% 5.14%
____________________
(1) Investments consist of interest-bearing deposits, securities purchased under agreements to resell, federal funds sold, trading securities, available-for-sale securities, and held- to-maturity securities.
(2) FHLBank capital stock is redeemable at the request of a member subject to the statutory redemption periods and other conditions and limitations. (See Note 13 - Capital to the accompanying combined financial statements for additional information on the statutory redemption periods and other conditions and limitations.)
(3) Dividend payout ratio is equal to dividends declared in the period expressed as a percentage of net income in the period. This ratio may not be as relevant to the combined balances because there are no shareholders at the FHLBank System-wide level.
(4) Return on average equity is equal to net income expressed as a percentage of average total capital.
(5) Mandatorily redeemable capital stock is not included in the calculations of return on average equity or average equity to average assets.
(6) Net interest margin is equal to net interest income represented as a percentage of average interest-earning assets.
(7) The regulatory capital-to-assets ratio is calculated based on the FHLBanks' regulatory capital as a percentage of total assets. (See Note 13 - Capital to the accompanying
combined financial statements for a definition and discussion of regulatory capital.)
© 2018 by Canfield Press, LLC. All rights reserved. www.canfieldpress.com 62
