
Page 8 - September October 2018 Disruption Report Flip Book
P. 8
TRUMP ADMINISTRATION SEJPATN.U-AORCYT.20210818
TRUMP ADMINISTRATION America is back
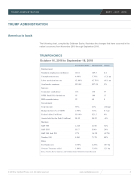
The following chart, compiled by Goldman Sachs, illustrates the changes that have occurred in the nation’s economy from November 2016 through September 2018.
TRUMPONOMICS
October 16, 2016 to September 18, 2018
Pre-election (10/16) Through 9/18 Change
Employment
Nonfarm employees (millions) 145.1 149.5 4.4
Unemployment rate 4.90% 3.70% (1.2) pp
Labor participation rate 62.80% 62.70%
(0.1) pp
Avg hourly earnings $25.88 $27.24
5%
Surveys
Consumer confidence 101 138
37
NFIB Small Biz Optimism 95 108
13
ISM manufacturing 52 60 8
Government
Corp tax rate 35% 21%
(14) pp
Budget deficit (% of GDP) 2.90% 3.8%
0.7 pp
Federal debt ($ trillion) $19.80 $21.5
9%
Assets held by the Fed ($ trillion) $4.52 $4.22
-6%
Markets
S&P 500 2,126 2,810
32%
S&P EPS $117 $140
20%
S&P 500 fwd P/E 17X 16.3X
(0.7X)
Nasdaq 100 4,861 7,178
48%
Rates
Fed funds rate 0.30% 2.20% 187 bp
10-year Treasury yield 1.80% 3.10%
121 bp
Source: FactSet, Haver Analytics, and Goldman Sachs Global Investment Research
© 2018 by Canfield Press, LLC. All rights reserved. www.canfieldpress.com 8
