
Page 27 - Finance Sustainability
P. 27
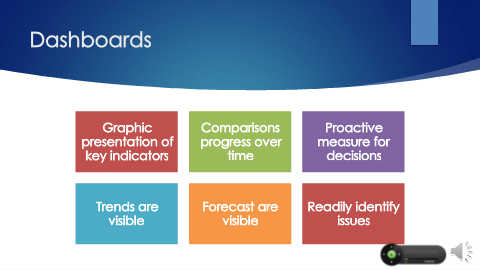
Dashboards


                                          Graphic                                Comparisons                                       Proactive

                                 presentation of                                 progress over                                  measure for


                                   key indicators                                           time                                   decisions


                                       Trends are                                 Forecast are                              Readily identify

                                            visible                                       visible                                       issues