
Page 8 - Data Driven
P. 8
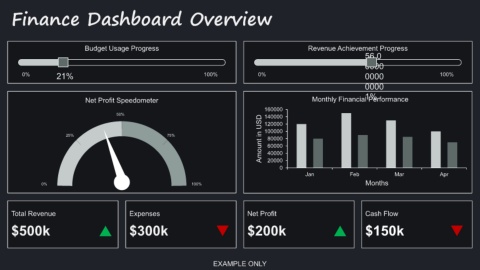
Finance Dashboard Overview


                                   Budget Usage Progress                                                                    Revenue Achievement Progress
                                                                                                                                                   56.0

                                                                                                                                                   0000

          0%            21%                                                       100%                  0%                                         0000                          100%
                                                                                                                                                   0000

                                                                                                                                                   1%
                                   Net Profit Speedometer                                                                     Monthly Financial Performance
                                                                                                           160000
                                                50%                                                        140000
                                                                                                          Amount in USD  80000
                                                                                                           120000

                           25%                                      75%                                    100000

                                                                                                            60000
                                                                                                            40000
                                                                                                            20000
                                                                                                                 0
                                                                                                                           Jan               Feb               Mar               Apr
                  0%                                                          100%                                                                 Months


     Total Revenue                                   Expenses                                       Net Profit                                     Cash Flow

     $500k                                           $300k                                          $200k                                          $150k


                                                                                      EXAMPLE ONLY