Page 17 - NC Hurricane Recovery Report
P. 17

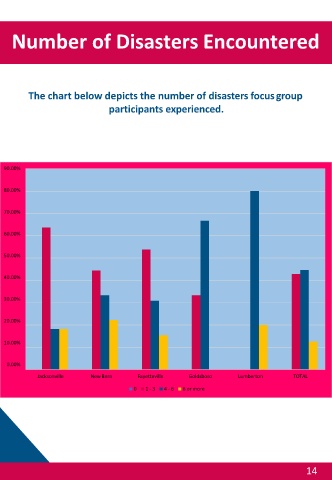
Number of Disasters Encountered


          The chart below depicts the number of disasters focusgroup

                                    participants experienced.


  90.00%


  80.00%


  70.00%


  60.00%


  50.00%


  40.00%


  30.00%


  20.00%


  10.00%


   0.00%
             Jacksonville      NewBern        Fayetteville    Goldsboro       Lumberton         TOTAL
                                             0  1 - 3  4 - 6  6 or more


                                                                                                     14
   12   13   14   15   16   17   18   19   20   21   22