
Page 29 - ONLINE LEARNING LIBRARY
P. 29
2 The environmental perspective
look at two aspects that will likely have featured prominently on your list: pollution (the
release of unwanted matter into the environment) and changes to the ecosystem
(alterations in the local habitats or environments because of the activities of the supply
chain). We will explore these two aspects in the following areas of the supply chain:
● logistics activities
● manufacturing and production activities
● waste disposal activities
2.1 The impact of logistics on the environment
When discussing logistics, both inbound and outbound logistics are considered. In other
words, the movements involved in sourcing and replenishing the raw materials,
components or finished goods needed for a business processes, as well as the
movements of goods from an organisation to its customers, back to suppliers or out for
disposal and recycling.
In the context of logistics, the prime concern tends to be pollution, or the impact of vehicle
emissions into the atmosphere, onto the road or into the water. Vehicle emissions
generally relate to burning fossil fuels and the gaseous and particulate emissions from the
engines.
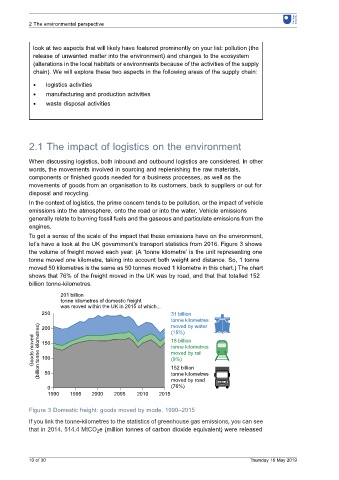
To get a sense of the scale of the impact that these emissions have on the environment,
let’s have a look at the UK government’s transport statistics from 2016. Figure 3 shows
the volume of freight moved each year. (A ‘tonne kilometre’ is the unit representing one
tonne moved one kilometre, taking into account both weight and distance. So, 1 tonne
moved 50 kilometres is the same as 50 tonnes moved 1 kilometre in this chart.) The chart
shows that 76% of the freight moved in the UK was by road, and that that totalled 152
billion tonne-kilometres.
201 billion
tonne kilometres of domestic freight
was moved within the UK in 2015 of which...
250 31 billion
tonne kilometres
moved by water
200
(15%)
Goods moved (billion tonne kilometres) 150 18 billion
tonne kilometres
moved by rail
100
(9%)
152 billion
50
tonne kilometres
moved by road
0 (76%)
1990 1995 2000 2005 2010 2015
Figure 3 Domestic freight: goods moved by mode, 1990–2015
If you link the tonne-kilometres to the statistics of greenhouse gas emissions, you can see
that in 2014, 514.4 MtCO 2 e (million tonnes of carbon dioxide equivalent) were released
10 of 30 Thursday 16 May 2019