
Page 62 - ONLINE LEARNING LIBRARY
P. 62
2 Exploration of debt
Activity 1
What factors do you believe were responsible for the increase in the proportion of
households that reported their debt as being a burden during the 2000s?
Comment
The prime reason for this upward trend was the reduction in ‘available’ income as a
result of higher household bills. The late 2000s saw sharp increases in certain livings
costs including foodstuffs, domestic fuel bills and petrol. At the same time, the
earnings of many households failed to keep pace with price inflation. Higher taxation –
at least for some income groups – may also have been a contributory factor in
reducing available income. Growing unemployment after 2007 was also a contributory
factor in reducing available income for some households, thereby making debts more
of a burden.
This evidence leads to a third issue to consider when determining whether debt levels are
a problem: how debt is distributed between different households, and whether debt is
causing problems for particular types of households. Certainly, while liabilities are more
than matched by assets across the UK as a whole, debt is more likely to be a major
problem for certain categories of individuals and households. For example, those on low
incomes and those in their twenties and thirties are more likely to have debt problems
(DTI, 2005). A 2007 survey commented that around 50 per cent of those describing debt
as a ‘serious problem’ were from a low-income group (Social Justice Policy Group, 2007).
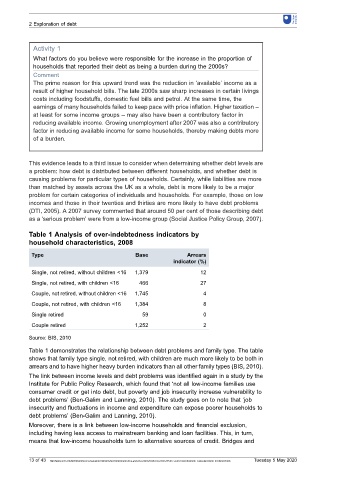
Table 1 Analysis of over-indebtedness indicators by
household characteristics, 2008
Type Base Arrears
indicator (%)
Single, not retired, without children <16 1,379 12
Single, not retired, with children <16 466 27
Couple, not retired, without children <16 1,745 4
Couple, not retired, with children <16 1,384 8
Single retired 59 0
Couple retired 1,252 2
Source: BIS, 2010
Table 1 demonstrates the relationship between debt problems and family type. The table
shows that family type single, not retired, with children are much more likely to be both in
arrears and to have higher heavy burden indicators than all other family types (BIS, 2010).
The link between income levels and debt problems was identified again in a study by the
Institute for Public Policy Research, which found that ‘not all low-income families use
consumer credit or get into debt, but poverty and job insecurity increase vulnerability to
debt problems’ (Ben-Galim and Lanning, 2010). The study goes on to note that ‘job
insecurity and fluctuations in income and expenditure can expose poorer households to
debt problems’ (Ben-Galim and Lanning, 2010).
Moreover, there is a link between low-income households and financial exclusion,
including having less access to mainstream banking and loan facilities. This, in turn,
means that low-income households turn to alternative sources of credit. Bridges and
13 of 43 http://www.open.edu/openlearn/money-management/money/personal-finance/you-and-your-money/content-section-0?utm_source=openlearnutm_campaign=olutm_medium=ebook Tuesday 5 May 2020