
Page 300 - ITGC_Audit Guides
P. 300
Appendix G. Sample Change
Management Metrics
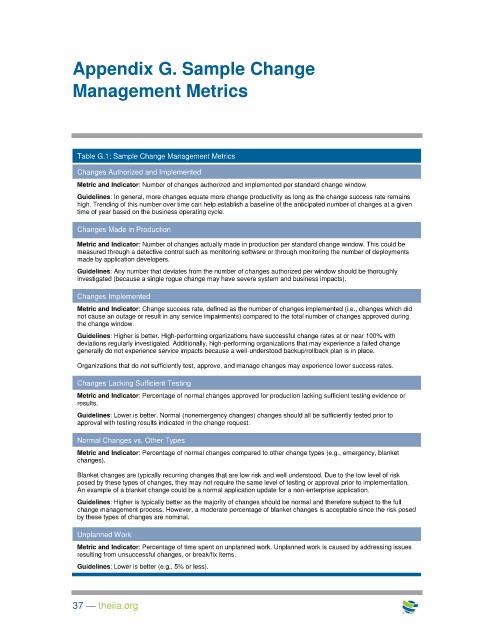
Table G.1: Sample Change Management Metrics
Changes Authorized and Implemented
Metric and Indicator: Number of changes authorized and implemented per standard change window.
Guidelines: In general, more changes equate more change productivity as long as the change success rate remains
high. Trending of this number over time can help establish a baseline of the anticipated number of changes at a given
time of year based on the business operating cycle.
Changes Made in Production
Metric and Indicator: Number of changes actually made in production per standard change window. This could be
measured through a detective control such as monitoring software or through monitoring the number of deployments
made by application developers.
Guidelines: Any number that deviates from the number of changes authorized per window should be thoroughly
investigated (because a single rogue change may have severe system and business impacts).
Changes Implemented
Metric and Indicator: Change success rate, defined as the number of changes implemented (i.e., changes which did
not cause an outage or result in any service impairments) compared to the total number of changes approved during
the change window.
Guidelines: Higher is better. High-performing organizations have successful change rates at or near 100% with
deviations regularly investigated. Additionally, high-performing organizations that may experience a failed change
generally do not experience service impacts because a well-understood backup/rollback plan is in place.
Organizations that do not sufficiently test, approve, and manage changes may experience lower success rates.
Changes Lacking Sufficient Testing
Metric and Indicator: Percentage of normal changes approved for production lacking sufficient testing evidence or
results.
Guidelines: Lower is better. Normal (nonemergency changes) changes should all be sufficiently tested prior to
approval with testing results indicated in the change request.
Normal Changes vs. Other Types
Metric and Indicator: Percentage of normal changes compared to other change types (e.g., emergency, blanket
changes).
Blanket changes are typically recurring changes that are low risk and well understood. Due to the low level of risk
posed by these types of changes, they may not require the same level of testing or approval prior to implementation.
An example of a blanket change could be a normal application update for a non-enterprise application.
Guidelines: Higher is typically better as the majority of changes should be normal and therefore subject to the full
change management process. However, a moderate percentage of blanket changes is acceptable since the risk posed
by these types of changes are nominal.
Unplanned Work
Metric and Indicator: Percentage of time spent on unplanned work. Unplanned work is caused by addressing issues
resulting from unsuccessful changes, or break/fix items.
Guidelines: Lower is better (e.g., 5% or less).
37 — theiia.org