
Page 518 - COSO Guidance Book
P. 518
8 | Developing Key Risk Indicators to Strengthen Enterprise Risk Management | Thought Leadership in ERM
Senior management may need to review KRI data for risks
and opportunities with significant potential impact to the KRI Status Trend
organization. Likewise, boards of directors may only require Retail Occ
updates of the most significant KRI data in order to be
confident that the risk management process is functioning RE Rental Market
as designed and approved. Dashboard reports that visually Change in Stores
display KRI data overlaying established trigger points can
provide both an intuitive and effective approach to providing Big Box Exp
this information to boards. As well, the simple use of color to Price Comp
depict the status of certain KRIs can quickly highlight those Debt Spreads
that require management attention. Green, yellow, and red
are common choices to display conditions associated with Interest Rates
being on target to meet plan goals, in some danger of not Stock Perf.
meeting plan goals, and not meeting plan goals, respectively.
Constr. Progress
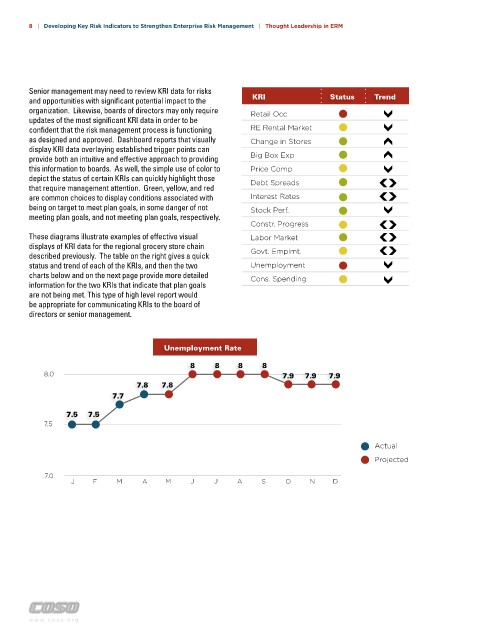
These diagrams illustrate examples of effective visual Labor Market
displays of KRI data for the regional grocery store chain Govt. Emplmt.
described previously. The table on the right gives a quick
status and trend of each of the KRIs, and then the two Unemployment
charts below and on the next page provide more detailed Cons. Spending
information for the two KRIs that indicate that plan goals
are not being met. This type of high level report would
be appropriate for communicating KRIs to the board of
directors or senior management.
Unemployment Rate
8 8 8 8
8.0 7.9 7.9 7.9
7.8 7.8
7.7
7.5 7.5
7.5
Actual
Projected
7.0
J F M A M J J A S O N D
Retail Occupancy %
90 88 88
86
85 85
85 84
82 82
80 80 80 81 Actual
80
Projected
75
J F M A M J J A S O N D
w w w . c o s o . o r g