
Page 81 - Supplement to Income Tax 2019
P. 81
12:52 - 11-Dec-2018
Page 16 of 17 Fileid: … /I1040SCHA/2018/A/XML/Cycle08/source
The type and rule above prints on all proofs including departmental reproduction proofs. MUST be removed before printing.
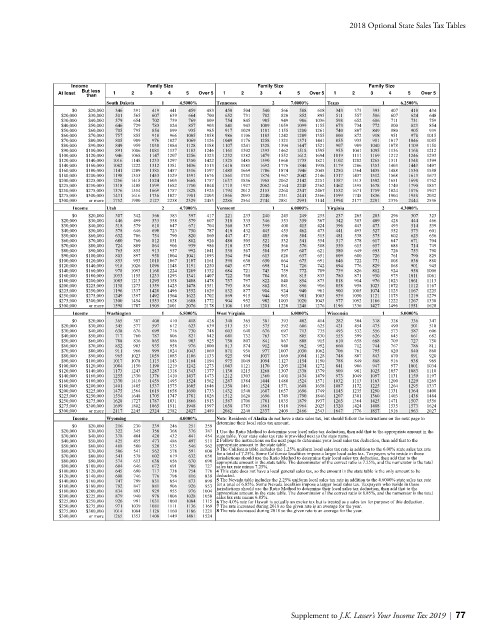
2018 Optional State Sales Tax Tables
Income Family Size Family Size Family Size
But less
At least 1 2 3 4 5 Over 5 1 2 3 4 5 Over 5 1 2 3 4 5 Over 5
than
South Dakota 1 4.5000% Tennessee 2 7.0000% Texas 1 6.2500%
$0 $20,000 346 391 419 441 459 483 450 504 540 566 588 618 343 373 393 407 418 434
$20,000 $30,000 501 565 607 639 664 700 652 731 782 820 852 895 511 557 586 607 624 648
$30,000 $40,000 579 654 702 739 769 809 754 845 905 949 986 1036 598 652 686 711 731 759
$40,000 $50,000 646 729 783 824 857 903 841 943 1009 1059 1099 1155 673 734 772 800 823 854
$50,000 $60,000 705 795 854 899 935 985 917 1029 1101 1155 1200 1261 740 807 849 880 905 939
$60,000 $70,000 757 855 918 966 1005 1058 986 1106 1183 1242 1289 1355 800 872 918 951 978 1015
$70,000 $80,000 805 909 976 1027 1069 1126 1049 1176 1258 1321 1371 1441 855 933 981 1017 1046 1085
$80,000 $90,000 849 959 1030 1084 1128 1188 1107 1241 1328 1394 1447 1521 907 989 1040 1078 1109 1150
$90,000 $100,000 891 1006 1081 1137 1183 1246 1161 1302 1393 1462 1518 1595 955 1041 1095 1136 1168 1212
$100,000 $120,000 946 1068 1147 1207 1256 1323 1232 1382 1479 1552 1612 1694 1019 1111 1169 1212 1246 1293
$120,000 $140,000 1016 1148 1233 1297 1350 1422 1325 1485 1590 1668 1733 1821 1102 1202 1265 1311 1348 1399
$140,000 $160,000 1082 1222 1312 1381 1436 1513 1410 1581 1692 1776 1844 1938 1179 1286 1353 1403 1443 1497
$160,000 $180,000 1141 1289 1385 1457 1516 1597 1488 1669 1786 1874 1946 2045 1250 1364 1435 1488 1530 1588
$180,000 $200,000 1198 1353 1453 1529 1591 1676 1561 1751 1874 1967 2042 2146 1317 1437 1512 1568 1613 1673
$200,000 $225,000 1256 1418 1524 1603 1668 1757 1637 1836 1965 2062 2142 2251 1387 1513 1592 1651 1698 1762
$225,000 $250,000 1318 1488 1599 1682 1750 1844 1718 1927 2062 2164 2248 2362 1462 1595 1678 1740 1790 1857
$250,000 $275,000 1376 1554 1669 1757 1828 1925 1794 2012 2153 2260 2347 2467 1532 1671 1759 1824 1876 1947
$275,000 $300,000 1431 1616 1736 1827 1901 2003 1866 2093 2240 2351 2441 2566 1599 1745 1836 1904 1958 2032
$300,000 or more 1752 1980 2127 2238 2329 2453 2286 2564 2744 2881 2991 3144 1994 2177 2291 2376 2444 2536
Income Utah 2 4.7000% Vermont 1 6.0000% Virginia 2 4.3000%
$0 $20,000 307 342 366 383 397 417 221 233 240 245 249 255 237 265 283 296 307 323
$20,000 $30,000 446 499 533 558 579 607 318 335 346 353 359 367 342 383 409 428 444 466
$30,000 $40,000 518 579 618 647 671 704 368 387 399 408 415 424 396 443 473 495 514 539
$40,000 $50,000 578 646 690 723 750 787 410 432 445 455 462 473 441 493 527 552 573 601
$50,000 $60,000 632 706 754 790 820 860 447 471 485 496 504 515 481 538 575 602 625 656
$60,000 $70,000 680 760 812 851 882 926 480 505 521 532 541 554 517 578 617 647 671 704
$70,000 $80,000 724 809 864 906 939 986 510 537 554 566 576 588 550 615 657 688 714 749
$80,000 $90,000 765 855 913 957 992 1041 538 567 584 597 607 621 580 649 693 726 753 790
$90,000 $100,000 803 897 958 1004 1041 1093 564 594 613 626 637 651 609 680 726 761 790 829
$100,000 $120,000 853 953 1018 1067 1107 1161 598 630 650 664 675 691 646 722 771 808 838 880
$120,000 $140,000 918 1026 1096 1148 1191 1250 643 677 698 714 726 742 694 776 829 868 901 945
$140,000 $160,000 978 1093 1168 1224 1269 1332 684 721 743 759 772 789 739 826 882 924 958 1006
$160,000 $180,000 1033 1155 1233 1293 1341 1407 722 760 784 801 815 833 780 871 930 975 1011 1061
$180,000 $200,000 1085 1213 1295 1358 1408 1478 757 797 822 840 854 873 818 914 976 1023 1061 1113
$200,000 $225,000 1138 1273 1359 1425 1478 1551 793 836 862 881 896 916 858 958 1023 1072 1112 1167
$225,000 $250,000 1196 1337 1428 1496 1552 1629 832 877 904 924 940 961 900 1005 1074 1125 1167 1225
$250,000 $275,000 1249 1397 1492 1564 1622 1702 869 915 944 965 981 1003 939 1050 1121 1175 1219 1279
$275,000 $300,000 1300 1454 1553 1628 1688 1772 904 952 982 1003 1020 1043 977 1092 1166 1222 1267 1330
$300,000 or more 1598 1787 1909 2001 2076 2178 1106 1165 1201 1228 1248 1276 1196 1336 1427 1496 1551 1628
Income Washington 1 6.5000% West Virginia 1 6.0000% Wisconsin 1 5.0000%
$0 $20,000 365 387 400 410 418 428 340 365 381 393 402 414 282 304 318 328 336 347
$20,000 $30,000 545 577 597 612 623 639 513 551 575 592 606 625 421 454 475 490 501 518
$30,000 $40,000 638 676 699 716 730 748 603 648 676 697 713 735 493 532 556 573 587 606
$40,000 $50,000 717 760 787 806 821 842 681 732 763 787 805 830 555 599 626 645 661 682
$50,000 $60,000 788 836 865 886 903 925 750 807 841 867 888 915 610 658 688 709 727 750
$60,000 $70,000 852 903 935 958 976 1000 813 874 912 940 962 992 660 712 744 767 786 811
$70,000 $80,000 911 966 999 1024 1043 1069 871 936 977 1007 1030 1062 706 761 795 820 840 868
$80,000 $90,000 965 1023 1059 1085 1106 1133 925 994 1037 1069 1094 1128 748 807 843 870 891 920
$90,000 $100,000 1017 1078 1115 1143 1164 1194 975 1049 1094 1127 1154 1190 788 849 888 916 938 969
$100,000 $120,000 1084 1150 1190 1219 1242 1273 1043 1121 1170 1205 1234 1272 841 906 947 977 1001 1034
$120,000 $140,000 1173 1243 1287 1318 1343 1377 1130 1215 1268 1307 1338 1379 909 981 1025 1057 1083 1118
$140,000 $160,000 1255 1330 1376 1410 1437 1473 1212 1303 1360 1401 1434 1479 973 1049 1097 1131 1159 1197
$160,000 $180,000 1330 1410 1459 1495 1524 1562 1287 1384 1444 1488 1524 1571 1032 1113 1163 1200 1229 1269
$180,000 $200,000 1401 1485 1537 1575 1605 1646 1358 1461 1524 1571 1608 1658 1087 1172 1225 1264 1295 1337
$200,000 $225,000 1475 1564 1619 1658 1690 1733 1432 1540 1607 1657 1696 1749 1145 1235 1290 1331 1364 1408
$225,000 $250,000 1554 1648 1705 1747 1781 1826 1512 1626 1696 1749 1790 1846 1207 1301 1360 1403 1438 1484
$250,000 $275,000 1628 1727 1787 1831 1866 1913 1587 1706 1781 1835 1879 1937 1265 1364 1425 1471 1507 1556
$275,000 $300,000 1699 1802 1865 1911 1948 1997 1658 1783 1861 1918 1964 2025 1320 1424 1488 1535 1573 1624
$300,000 or more 2117 2245 2324 2382 2427 2489 2082 2240 2337 2409 2466 2543 1647 1776 1857 1916 1963 2027
Income Wyoming 1 4.0000% Note: Residents of Alaska do not have a state sales tax, but should follow the instructions on the next page to
$0 $20,000 216 230 239 246 251 259 determine their local sales tax amount.
$20,000 $30,000 322 345 358 368 376 387 1 Use the Ratio Method to determine your local sales tax deduction, then add that to the appropriate amount in the
$30,000 $40,000 378 404 420 432 441 454 state table. Your state sales tax rate is provided next to the state name.
$40,000 $50,000 425 455 473 486 497 511 2 Follow the instructions on the next page to determine your local sales tax deduction, then add that to the
$50,000 $60,000 468 500 520 535 546 562 appropriate amount in the state table.
$60,000 $70,000 506 541 562 578 591 608 3 The California table includes the 1.25% uniform local sales tax rate in addition to the 6.00% state sales tax rate
for a total of 7.25%. Some California localities impose a larger local sales tax. Taxpayers who reside in those
$70,000 $80,000 541 578 602 619 632 650 jurisdictions should use the Ratio Method to determine their local sales tax deduction, then add that to the
$80,000 $90,000 574 613 638 656 670 690 appropriate amount in the state table. The denominator of the correct ratio is 7.25%, and the numerator is the total
$90,000 $100,000 604 646 672 691 706 727 sales tax rate minus 7.25%.
$100,000 $120,000 645 690 717 738 754 776 4 This state does not have a local general sales tax, so the amount in the state table is the only amount to be
$120,000 $140,000 698 746 776 798 816 839 deducted.
$140,000 $160,000 747 799 831 854 873 899 5 The Nevada table includes the 2.25% uniform local sales tax rate in addition to the 4.6000% state sales tax rate
$160,000 $180,000 792 847 881 906 926 953 for a total of 6.85%. Some Nevada localities impose a larger local sales tax. Taxpayers who reside in those
$180,000 $200,000 834 893 929 955 976 1004 jurisdictions should use the Ratio Method to determine their local sales tax deduction, then add that to the
appropriate amount in the state table. The denominator of the correct ratio is 6.85%, and the numerator is the total
$200,000 $225,000 879 940 978 1006 1028 1058 sales tax rate minus 6.85%.
$225,000 $250,000 926 991 1031 1060 1084 1115 6 The 4.0% rate for Hawaii is actually an excise tax but is treated as a sales tax for purpose of this deduction.
$250,000 $275,000 971 1039 1081 1111 1136 1169 7 The rate increased during 2018 so the given rate is an average for the year.
$275,000 $300,000 1014 1084 1128 1160 1186 1221 8 The rate decreased during 2018 so the given rate is an average for the year.
$300,000 or more 1265 1353 1408 1449 1481 1524
Supplement to J.K. Lasser’s Your Income Tax 2019 | 77