
Page 8 - Dec 2021 Report
P. 8
December Report
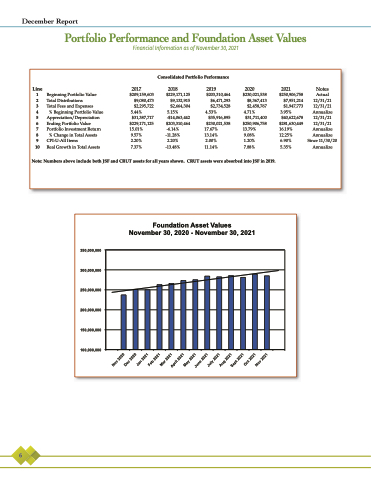
Portfolio Performance and Foundation Asset Values
Financial Information as of November 30, 2021
Line 1
2
3
4
5
6
7
8
9 10
2017 $209,159,603
$9,080,473
$229,171,125 15.01%
9.57% 2.20% 7.37%
2018 $229,171,125
$9,132,915
$2,664,304 5.15%
-$14,063,442 $203,310,464 -6.14% -11.28%
2.20% -13.48%
2019 $203,310,464
$6,471,293
$2,734,528 4.53%
$35,916,895 $230,021,538
17.67% 13.14% 2.00% 11.14%
2020 $230,021,538
$8,367,413
$2,458,767 4.71%
$31,711,400 $250,906,758 13.79%
9.08% 1.20% 7.88%
2021 $250,906,758
$7,951,214
$1,947,773 3.95%
$40,622,678 $281,630,449 16.19% 12.25%
6.90% 5.35%
Notes
Actual 12/31/21 12/31/21 Annualize 12/31/21 12/31/21 Annualize Annualize Since 11/30/20 Annualize
Consolidated Portfolio Performance
Beginning Portfolio Value Total Distributions
Total Fees and Expenses
% Beginning Portfolio Value Appreciation/Depreciation $31,387,717
Ending Portfolio Value Portfolio Investment Return
% Change in Total Assets CPI-U-All Items
Real Growth in Total Assets
$2,295,722 5.44%
Note: Numbers above include both JSF and CRUT assets for all years shown. CRUT assets were absorbed into JSF in 2019.
350,000,000 300,000,000 250,000,000 200,000,000 150,000,000 100,000,000
Foundation Asset Values November 30, 2020 - November 30, 2021
6
