


Page 770 - PPL BEG-engelsk
P. 770
Aircraft general knowledge


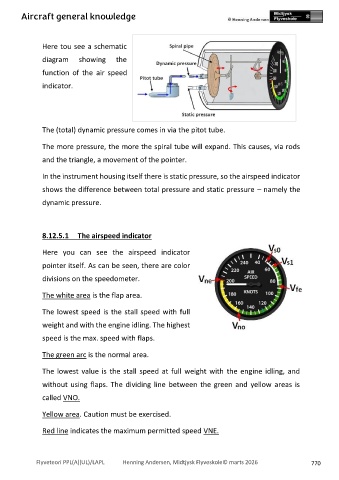
                Here tou see a schematic

                diagram      showing      the

                function  of  the  air  speed

                indicator.


                The (total) dynamic pressure comes in via the pitot tube.

                The more pressure, the more the spiral tube will expand. This causes, via rods

                and the triangle, a movement of the pointer.


                In the instrument housing itself there is static pressure, so the airspeed indicator

                shows the difference between total pressure and static pressure – namely the

                dynamic pressure.


                8.12.5.1     The airspeed indicator

                Here  you  can  see  the  airspeed  indicator


                pointer itself. As can be seen, there are color
                divisions on the speedometer.


                The white area is the flap area.


                The lowest speed is the stall speed with full
                weight and with the engine idling. The highest

                speed is the max. speed with flaps.


                The green arc is the normal area.


                The lowest  value is the stall speed at full weight with  the engine idling, and

                without using flaps. The dividing line between the green and  yellow areas is
                called VNO.


                Yellow area. Caution must be exercised.


                Red line indicates the maximum permitted speed VNE.


              Flyveteori PPL(A)(UL)/LAPL             Henning Andersen, Midtjysk Flyveskole© marts 2026        770

