
Page 260 - FlipBook BACK FROM SARAN - MAY 5 2020 - Don't Make Me Say I Told You So_6.14x9.21_v9_Neat
P. 260
246 Don’t Make Me Say I Told You So
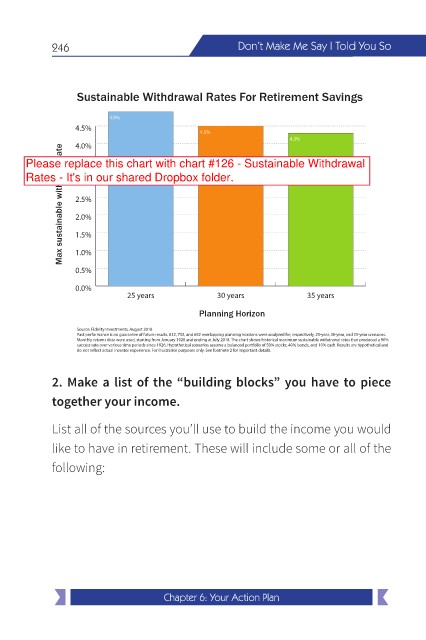
Sustainable Withdrawal Rates For Retirement Savings
4.9%
4.5%
4.5%
4.3%
4.0%
Max sustainable withdrawl rate 2.5%
3.5%
Please replace this chart with chart #126 - Sustainable Withdrawal
Rates - It's in our shared Dropbox folder.
3.0%
2.0%
1.5%
1.0%
0.5%
0.0%
25 years 30 years 35 years
Planning Horizon
Source: Fidelity Investments, August 2018
Past performance is no guarantee of future results. 812, 752, and 692 overlapping planning horizons were analyzed for, respectively, 25-year, 30-year, and 35-year scenarios.
Monthly returns data were used, starting from January 1926 and ending at July 2018. The chart shows historical maximum sustainable withdrawal rates that produced a 90%
success rate over various time periods since 1926. Hypothetical scenarios assume a balanced portfolio of 50% stocks, 40% bonds, and 10% cash. Results are hypothetical and
do not re ect actual investor experience. For illustrative purposes only. See footnote 2 for important details.
2. Make a list of the “building blocks” you have to piece
together your income.
List all of the sources you’ll use to build the income you would
like to have in retirement. These will include some or all of the
following:
Chapter 6: Your Action Plan