
Page 117 - The Toxicology of Fishes
P. 117
Toxicokinetics in Fishes 97
A
1 2 3
4
B
1 2
2 1 3
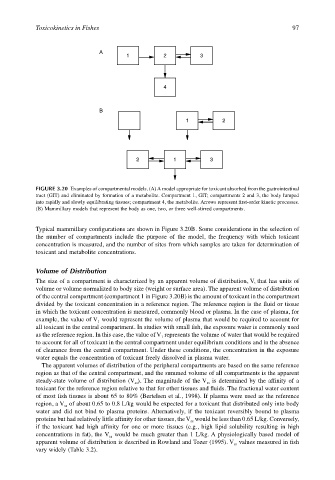
FIGURE 3.20 Examples of compartmental models. (A) A model appropriate for toxicant absorbed from the gastrointestinal
tract (GIT) and eliminated by formation of a metabolite. Compartment 1, GIT; compartments 2 and 3, the body lumped
into rapidly and slowly equilibrating tissues; compartment 4, the metabolite. Arrows represent first-order kinetic processes.
(B) Mammillary models that represent the body as one, two, or three well-stirred compartments.
Typical mammillary configurations are shown in Figure 3.20B. Some considerations in the selection of
the number of compartments include the purpose of the model, the frequency with which toxicant
concentration is measured, and the number of sites from which samples are taken for determination of
toxicant and metabolite concentrations.
Volume of Distribution
The size of a compartment is characterized by an apparent volume of distribution, V, that has units of
volume or volume normalized to body size (weight or surface area). The apparent volume of distribution
of the central compartment (compartment 1 in Figure 3.20B) is the amount of toxicant in the compartment
divided by the toxicant concentration in a reference region. The reference region is the fluid or tissue
in which the toxicant concentration is measured, commonly blood or plasma. In the case of plasma, for
example, the value of V would represent the volume of plasma that would be required to account for
1
all toxicant in the central compartment. In studies with small fish, the exposure water is commonly used
as the reference region. In this case, the value of V represents the volume of water that would be required
1
to account for all of toxicant in the central compartment under equilibrium conditions and in the absence
of clearance from the central compartment. Under these conditions, the concentration in the exposure
water equals the concentration of toxicant freely dissolved in plasma water.
The apparent volumes of distribution of the peripheral compartments are based on the same reference
region as that of the central compartment, and the summed volume of all compartments is the apparent
steady-state volume of distribution (V ). The magnitude of the V is determined by the affinity of a
ss
ss
toxicant for the reference region relative to that for other tissues and fluids. The fractional water content
of most fish tissues is about 65 to 80% (Bertelsen et al., 1998). If plasma were used as the reference
region, a V of about 0.65 to 0.8 L/kg would be expected for a toxicant that distributed only into body
ss
water and did not bind to plasma proteins. Alternatively, if the toxicant reversibly bound to plasma
proteins but had relatively little affinity for other tissues, the V would be less than 0.65 L/kg. Conversely,
ss
if the toxicant had high affinity for one or more tissues (e.g., high lipid solubility resulting in high
concentrations in fat), the V would be much greater than 1 L/kg. A physiologically based model of
ss
apparent volume of distribution is described in Rowland and Tozer (1995). V values measured in fish
ss
vary widely (Table 3.2).