
Page 136 - The Toxicology of Fishes
P. 136
116 The Toxicology of Fishes
A
140
TCDD CONCENTRATION (pg/g) 100
120
WHOLE-BODY 60
80
40
20
0
0 50 100 150 200
B
1.00
0.80
NET ASSIMILATION EFFICIENCY 0.60
0.40
0.20
0.00
0 50 100 150 200
DAYS
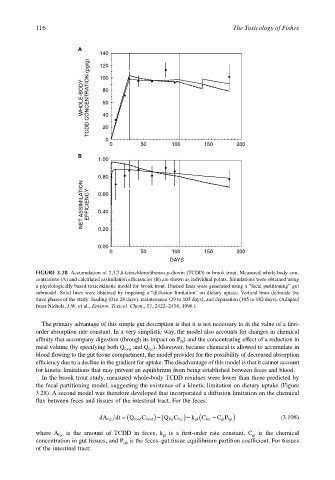
FIGURE 3.28 Accumulation of 2,3,7,8-tetrachlorodibenzo-p-dioxin (TCDD) in brook trout. Measured whole-body con-
centrations (A) and calculated assimilation efficiencies (B) are shown as individual points. Simulations were obtained using
a physiologically based toxicokinetic model for brook trout. Dashed lines were generated using a “fecal partitioning” gut
submodel. Solid lines were obtained by imposing a “diffusion limitation” on dietary uptake. Vertical lines delineate the
three phases of the study: loading (0 to 28 days), maintenance (29 to 105 days), and depuration (105 to 182 days). (Adapted
from Nichols, J.W. et al., Environ. Toxicol. Chem., 17, 2422–2434, 1998.)
The primary advantage of this simple gut description is that it is not necessary to fit the value of a first-
order absorption rate constant. In a very simplistic way, the model also accounts for changes in chemical
affinity that accompany digestion (through its impact on P ) and the concentrating effect of a reduction in
fb
meal volume (by specifying both Q food and Q ). Moreover, because chemical is allowed to accumulate in
fec
blood flowing to the gut tissue compartment, the model provides for the possibility of decreased absorption
efficiency due to a decline in the gradient for uptake. The disadvantage of this model is that it cannot account
for kinetic limitations that may prevent an equilibrium from being established between feces and blood.
In the brook trout study, measured whole-body TCDD residues were lower than those predicted by
the fecal partitioning model, suggesting the existence of a kinetic limitation on dietary uptake (Figure
3.28). A second model was therefore developed that incorporated a diffusion limitation on the chemical
flux between feces and tissues of the intestinal tract. For the feces:
dt = ( C food) −( Q C fec) − ( C fec − C gt P fgt)
dA fec Q food fec k gt P (3.108)
where A is the amount of TCDD in feces, k is a first-order rate constant, C is the chemical
gt
fec
gt
concentration in gut tissues, and P is the feces–gut tissue equilibrium partition coefficient. For tissues
fgt
of the intestinal tract: