
Page 619 - The Toxicology of Fishes
P. 619
Toxicity Resistance 599
120
30
LC50
LC50
Survival
100 20
80 10 0
Survival (%) 60 Chemical Concentration
4
6
2
0
40 LC 50 LC 50
20
0
0 1 2 3 4 5 6
Chemical Concentration
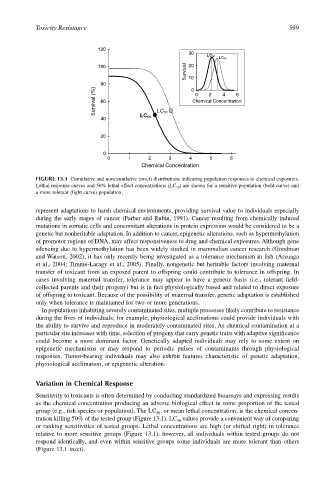
FIGURE 13.1 Cumulative and noncumulative (inset) distributions indicating population responses to chemical exposures.
Lethal response curves and 50% lethal effect concentrations (LC 50 ) are shown for a sensitive population (bold curve) and
a more tolerant (light curve) population.
represent adaptations to harsh chemical environments, providing survival value to individuals especially
during the early stages of cancer (Farber and Rubin, 1991). Cancer resulting from chemically induced
mutations in somatic cells and concomitant alterations in protein expression would be considered to be a
genetic but nonheritable adaptation. In addition to cancer, epigenetic alterations, such as hypermethylation
of promotor regions of DNA, may affect responsiveness to drug and chemical exposures. Although gene
silencing due to hypermethylation has been widely studied in mammalian cancer research (Goodman
and Watson, 2002), it has only recently being investigated as a tolerance mechanism in fish (Arzuaga
et al., 2004; Timme-Laragy et al., 2005). Finally, nongenetic but heritable factors involving maternal
transfer of toxicant from an exposed parent to offspring could contribute to tolerance in offspring. In
cases involving maternal transfer, tolerance may appear to have a genetic basis (i.e., tolerant field-
collected parents and their progeny) but is in fact physiologically based and related to direct exposure
of offspring to toxicant. Because of the possibility of maternal transfer, genetic adaptation is established
only when tolerance is maintained for two or more generations.
In populations inhabiting severely contaminated sites, multiple processes likely contribute to resistance
during the lives of individuals; for example, physiological acclimations could provide individuals with
the ability to survive and reproduce in moderately contaminated sites. As chemical contamination at a
particular site increases with time, selection of progeny that carry genetic traits with adaptive significance
could become a more dominant factor. Genetically adapted individuals may rely to some extent on
epigenetic mechanisms or may respond to periodic pulses of contaminants through physiological
responses. Tumor-bearing individuals may also exhibit features characteristic of genetic adaptation,
physiological acclimation, or epigenetic alteration.
Variation in Chemical Response
Sensitivity to toxicants is often determined by conducting standardized bioassays and expressing results
as the chemical concentration producing an adverse biological effect in some proportion of the tested
group (e.g., fish species or population). The LC , or mean lethal concentration, is the chemical concen-
50
tration killing 50% of the tested group (Figure 13.1). LC values provide a convenient way of comparing
50
or ranking sensitivities of tested groups. Lethal concentrations are high (or shifted right) in tolerance
relative to more sensitive groups (Figure 13.1); however, all individuals within tested groups do not
respond identically, and even within sensitive groups some individuals are more tolerant than others
(Figure 13.1 inset).