
Page 21 - Linear Models for the Prediction of Animal Breeding Values
P. 21
As mentioned earlier, the difference between repeated records of an individual
is assumed to be due to temporary environmental differences between successive
performances. However, if successive records are known to be affected by factors
that influence performance, these must be corrected for. For instance, differences
in age at calving in first and second lactations may influence milk yield in first and
second lactations. Such age differences should be adjusted for before using the
means of both lactations for breeding-value prediction.
The accuracy of the EBV is:
r = cov( )
,
a
ay a y) / (ss y
,
2 ( − 2
= s a /(s a t [ + 1 t) / n]s y )
= hn [/ ( + n ( − 1 ))]
1
t )
= [nh 2 / ( + ( − 1 ) )] = b
1
t
n
Compared with single records, there is a gain in the accuracy of prediction with
repeated records from the above equation, which is dependent on the value of repeat-
ability and the number of records. This gain in accuracy results mainly from the
reduction in temporary environmental variance (within-individual variance) as the
number of records increases. When t is low, this gain is substantial as the number of
records increases. When t is high, there is little gain in accuracy with repeated records
compared with using only single records. The gain in accuracy from repeated records
compared with selection on single records can be obtained as the ratio of accuracy
from repeated records (r ) to that from single records (r ):
n k
h 2
(1 − t)
t+
n r n 1
= =
k r h t+ (1 − t)
n
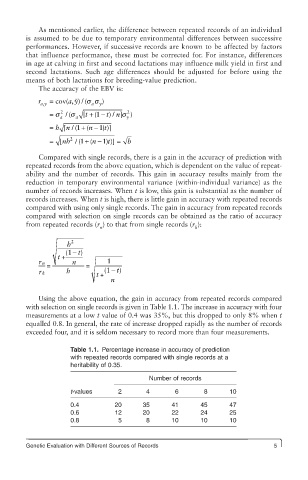
Using the above equation, the gain in accuracy from repeated records compared
with selection on single records is given in Table 1.1. The increase in accuracy with four
measurements at a low t value of 0.4 was 35%, but this dropped to only 8% when t
equalled 0.8. In general, the rate of increase dropped rapidly as the number of records
exceeded four, and it is seldom necessary to record more than four measurements.
Table 1.1. Percentage increase in accuracy of prediction
with repeated records compared with single records at a
heritability of 0.35.
Number of records
t-values 2 4 6 8 10
0.4 20 35 41 45 47
0.6 12 20 22 24 25
0.8 5 8 10 10 10
Genetic Evaluation with Different Sources of Records 5