
Page 68 - 2021 ANNUAL REPORT draft
P. 68
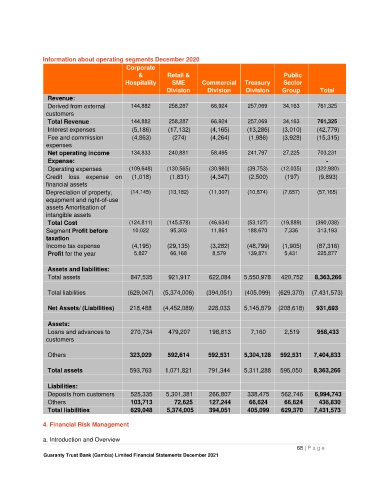
Information about operating segments December 2020
                                           Corporate
                                               &        Retail &                               Public
                                          Hospitality     SME       Commercial   Treasury      Sector
                                                        Division      Division    Division    Group        Total
                 Revenue:
                 Derived from external      144,882      258,287       66,924      257,069     34,163     761,325
                customers
                 Total Revenue              144,882      258,287       66,924      257,069     34,163     761,325
                 Interest expenses           (5,186)     (17,132)      (4,165)     (13,286)     (3,010)     (42,779)
                 Fee and commission          (4,863)      (274)        (4,264)      (1,986)     (3,928)     (15,315)
                expenses
                 Net operating income       134,833      240,881       58,495      241,797     27,225     703,231
                 Expense:                                                                                    -
                 Operating expenses         (109,648)    (130,565)    (30,980)     (39,753)    (12,035)    (322,980)
                Credit  loss  expense  on    (1,018)      (1,831)      (4,347)      (2,500)     (197)      (9,893)
                financial assets
                Depreciation of property,   (14,145)     (13,182)     (11,307)     (10,874)    (7,657)    (57,165)
                equipment and right-of-use
                assets Amortisation of
                intangible assets
                 Total Cost                 (124,811)    (145,578)    (46,634)     (53,127)    (19,889)    (390,038)
                Segment Profit before        10,022      95,303        11,861      188,670     7,336      313,193
                taxation
                Income tax expense           (4,195)    (29,135)       (3,282)     (48,799)     (1,905)      (87,316)
                 Profit for the year         5,827       66,168        8,579       139,871     5,431      225,877

                 Assets and liabilities:
                 Total assets                847,535      921,917      622,084     5,550,978     420,752     8,363,266

                 Total liabilities         (629,047)    (5,374,006)    (394,051)    (405,099)   (629,370)   (7,431,573)

                 Net Assets/ (Liabilities)     218,488     (4,452,089)    228,033     5,145,879    (208,618)    931,693

                 Assets:
                 Loans and advances to       270,734      479,207      198,813      7,160       2,519     958,433
                customers

                 Others                     323,029     592,614       592,531     5,304,128    592,531     7,404,833

                 Total assets               593,763     1,071,821     791,344     5,311,288   595,050    8,363,266

                 Liabilities:
                 Deposits from customers      525,335      5,301,381      266,807      338,475     562,746     6,994,743
                 Others                      103,713           72,625     127,244      66,624        66,624       436,830
                 Total liabilities           629,048      5,374,005     394,051      405,099     629,370    7,431,573

               4. Financial Risk Management

               a. Introduction and Overview
                                                                                                   68 | P a g e
               Guaranty Trust Bank (Gambia) Limited Financial Statements December 2021