Page 494 - AR PAM 2024 HIGHRES_4 Direksi
P. 494

Laporan Keberlanjutan
            Sustainability Report


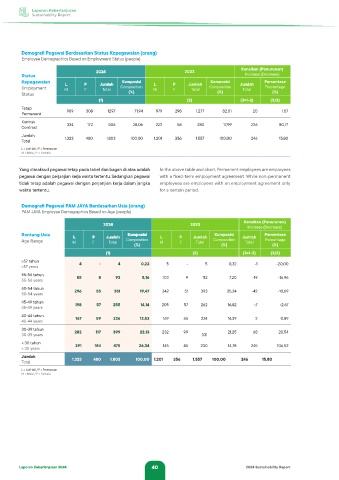
         Demografi Pegawai Berdasarkan Status Kepegawaian (orang)
         Employee Demographics Based on Employment Status (people)

                                   202
                                     4
                                   2024                           2023                Kenaikan (Penurunan)
         Status                                                                        Increase (Decrease)
         Kepegawaian    L L    P P  Jumlah  K omposisi  L     P    Jumlah  Komposisi  Jumlah  Persentase
                                            Komposisi
                                    Jumlah
         Employment     M      F     Total  Composition   M   F     Total  Composition   Total  Percentage
         Status                               (%)                            (%)                 (%)
                                    (1) (1)                        (2)               (3=1-2)    (3/2)
         Tetap
         Permanent      989    308     1297     71,94   979   298     1.277    82,01      20        1,57
         Kontrak
         Contract        334    172    506      28,06   222    58     280      17,99     226       80,71
         Jumlah         1.323  480    1.803    100,00  1.201  356     1.557   100,00     246       15,80
         Total
         L = Laki-laki / P = Perempuan
         M = Male / F = Female

        Yang dimaksud pegawai tetap pada tabel dan bagan di atas adalah   In the above table and chart, Permanent employees are employees
        pegawai dengan perjanjian kerja waktu tertentu. Sedangkan pegawai   with a fixed-term employment agreement. While non-permanent
        tidak tetap adalah pegawai dengan perjanjian kerja dalam jangka   employees are employees with an employment agreement only
        waktu tertentu.                                  for a certain period.

         Demografi Pegawai PAM JAYA Berdasarkan Usia (orang)
         PAM JAYA Employee Demographics Based on Age (people)
                                     202
                                     2024 4                         2023               Kenaikan (Penurunan)
                                                                                        Increase (Decrease)
                                               omposisi
         Rentang Usia      L L   P P  Jumlah  Komposisi  L      P    Jumlah  Komposisi  Jumlah  Persentase
                                              K
                                      Jumlah
         Age Range        M      F     Total  Composition   M   F     Total  Composition   Total  Percentage
                                                (%)                            (%)               (%)
                                      (1) (1)                        (2)              (3=1-2)   (3/2)
         >57 tahun           4      -     4        0,22
         >57 years                                         5       -     5       0,32     -1      -20,00
         55-56 tahun        85      8     93       5,16
         55-56 years                                      103     9     112       7,20    -19      -16,96
         50-54 tahun       296     55    351      19,47   342     51    393      25,24   -42       -10,69
         50-54 years
         45-49 tahun       198     57    255      14,14   205     57    262      16,82    -7       -2,67
         45-49 years
         40-44 tahun        167    59    226      12,53   169    55     224      14,39     2        0,89
         40-44 years
         30-39 tahun       282     117   399      22,13   232     99             21,25    68       20,54
         30-39 years                                                    331
         < 30 tahun        291    184    475      26,34   145     85   230       14,78   245      106,52
         < 30 years
         Jumlah           1.323   480   1.803    100,00 1.201  356   1.557  100,00    246    15,80
         Total
         L = Laki-laki / P = Perempuan
         M = Male / F = Female


        Laporan Keberlanjutan 2024                    40                               2024 Sustainability Report
   489   490   491   492   493   494   495   496   497   498   499