
Page 13 - UGU Dstrct Mun IDP Report '21-22
P. 13
1.1.1 Demographics Overview
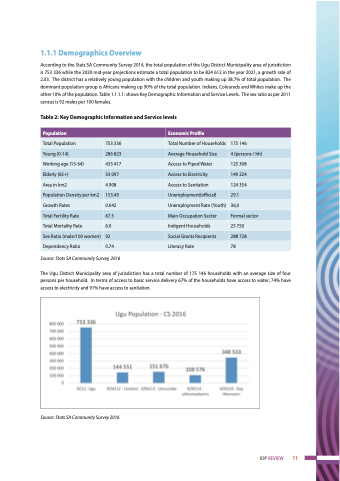
According to the Stats SA Community Survey 2016, the total population of the Ugu District Municipality area of jurisdiction is 753 336 while the 2020 mid-year projections estimate a total population to be 824 612 in the year 2021, a growth rate of 2.03. The district has a relatively young population with the children and youth making up 38.7% of total population. The dominant population group is Africans making up 90% of the total population. Indians, Coloureds and Whites make up the other 10% of the population. Table 1.1.1.1: shows Key Demographic Information and Service Levels. The sex ratio as per 2011 census is 92 males per 100 females.
Table 2: Key Demographic Information and Service levels
Population
Economic Profile
Total Population
753 336
Total Number of Households
175 146
Young (0-14)
286 823
Average Household Size
4 (persons / hh)
Working age (15-64)
433 417
Access to Piped Water
125 308
Elderly (65+)
33 097
Access to Electricity
149 224
Area in km2
4 908
Access to Sanitation
124 354
Population Density per km2
153.49
Unemployment(official)
29.1
Growth Rates
0.042
Unemployment Rate (Youth)
36,0
Total Fertility Rate
67.5
Main Occupation Sector
Formal sector
Total Mortality Rate
6.0
Indigent Households
25 750
Sex Ratio (male/100 women)
92
Social Grants Recipients
288 728
Dependency Ratio
0.74
Literacy Rate
78
Source: Stats SA Community Survey, 2016
The Ugu District Municipality area of jurisdiction has a total number of 175 146 households with an average size of four persons per household. In terms of access to basic service delivery 67% of the households have access to water; 74% have access to electricity and 91% have access to sanitation.
Source: Stats SA Community Survey 2016
IDP REVIEW 11
