
Page 14 - UGU Dstrct Mun IDP Report '21-22
P. 14
12
UGU DISCTRICT MUNICIPALITY
The above graph shows the population of the district as per the 2016 community survey then further categorises it in the different Local Municipalities.
Source: Stats SA Community Survey 2016
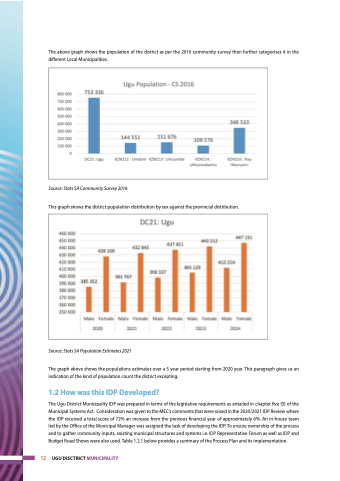
This graph shows the district population distribution by sex against the provincial distribution.
Source: Stats SA Population Estimates 2021
The graph above shows the populations estimates over a 5 year period starting from 2020 year. This paragraph gives us an indication of the kind of population count the district excepting.
1.2 How was this IDP Developed?
The Ugu District Municipality IDP was prepared in terms of the legislative requirements as entailed in chapter five (5) of the Municipal Systems Act. Consideration was given to the MEC’s comments that were raised in the 2020/2021 IDP Review where the IDP received a total score of 72% an increase from the previous financial year of approximately 6%. An in-house team led by the Office of the Municipal Manager was assigned the task of developing the IDP. To ensure ownership of the process and to gather community inputs, existing municipal structures and systems i.e. IDP Representative Forum as well as IDP and Budget Road Shows were also used. Table 1.2.1 below provides a summary of the Process Plan and its implementation.
