
Page 145 - UGU Dstrct Mun IDP Report '21-22
P. 145
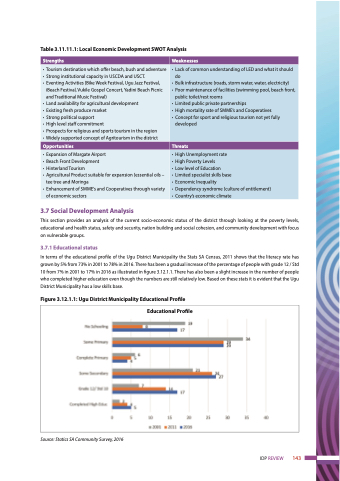
 Table 3.11.11.1: Local Economic Development SWOT Analysis
 Strengths
  Weaknesses
   • Tourism destination which offer beach, bush and adventure
• Strong institutional capacity in USCDA and USCT.
• Eventing Activities (Bike Week Festival, Ugu Jazz Festival,
iBeach Festival, Vukile Gospel Concert, Yadini Beach Picnic
and Traditional Music Festival)
• Land availability for agricultural development
• Existing fresh produce market
• Strong political support
• High level staff commitment
• Prospects for religious and sports tourism in the region
• Widely supported concept of Agritourism in the district
 • Lack of common understanding of LED and what it should do
• Bulk infrastructure (roads, storm water, water, electricity)
• Poor maintenance of facilities (swimming pool, beach front,
public toilet/rest rooms
• Limited public private partnerships
• High mortality rate of SMME’s and Cooperatives
• Concept for sport and religious tourism not yet fully
developed
 Opportunities
  Threats
   • Expansion of Margate Airport
• Beach Front Development
• HinterlandTourism
• Agricultural Product suitable for expansion (essential oils –
tee tree and Moringa
• Enhancement of SMME’s and Cooperatives through variety
of economic sectors
  • High Unemployment rate
• High Poverty Levels
• Low level of Education
• Limited specialist skills base • Economic Inequality
• Dependency syndrome (culture of entitlement) • Country’s economic climate
    3.7 Social Development Analysis
This section provides an analysis of the current socio-economic status of the district through looking at the poverty levels, educational and health status, safety and security, nation building and social cohesion, and community development with focus on vulnerable groups.
3.7.1 Educational status
In terms of the educational profile of the Ugu District Municipality the Stats SA Census, 2011 shows that the literacy rate has grown by 5% from 73% in 2001 to 78% in 2016. There has been a gradual increase of the percentage of people with grade 12 / Std 10 from 7% in 2001 to 17% in 2016 as illustrated in figure 3.12.1.1. There has also been a slight increase in the number of people who completed higher education even though the numbers are still relatively low. Based on these stats it is evident that the Ugu District Municipality has a low skills base.
Figure 3.12.1.1: Ugu District Municipality Educational Profile
 Educational Profile
Source: Statics SA Community Survey, 2016
IDP REVIEW 143
