
Page 146 - UGU Dstrct Mun IDP Report '21-22
P. 146
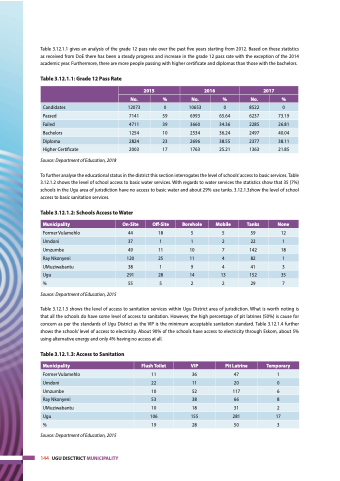
 Table 3.12.1.1 gives an analysis of the grade 12 pass rate over the past five years starting from 2012. Based on these statistics as received from DoE there has been a steady progress and increase in the grade 12 pass rate with the exception of the 2014 academic year. Furthermore, there are more people passing with higher certificate and diplomas than those with the bachelors.
Table 3.12.1.1: Grade 12 Pass Rate
  2015
 2016
 2017
 No.
 %
 No.
 %
 No.
 %
 Candidates
 12073
 0
 10653
 0
 8522
 0
 Passed
 7141
 59
 6993
 65.64
 6237
 73.19
 Failed
 4711
 39
 3660
 34.36
 2285
 26.81
 Bachelors
 1254
 10
 2534
 36.24
 2497
 40.04
 Diploma
 2824
 23
 2696
 38.55
 2377
 38.11
 Higher Certificate
  2003
  17
  1763
  25.21
  1363
  21.85
    Source: Department of Education, 2018
To further analyse the educational status in the district this section interrogates the level of schools’ access to basic services. Table 3.12.1.2 shows the level of school access to basic water services. With regards to water services the statistics show that 35 (7%) schools in the Ugu area of jurisdiction have no access to basic water and about 29% use tanks. 3.12.1.3show the level of school access to basic sanitation services.
Table 3.12.1.2: Schools Access to Water
 Municipality
 On-Site
 Off-Site
 Borehole
 Mobile
 Tanks
 None
 Former Vulamehlo
 44
 18
 5
 5
 59
 12
 Umdoni
 37
 1
 1
 2
 22
 1
 Umzumbe
 49
 11
 10
 7
 142
 18
 Ray Nkonyeni
 120
 25
 11
 4
 82
 1
 UMuziwabantu
 38
 1
 9
 4
 41
 3
 Ugu
 291
 28
 14
 13
 152
 35
 %
  55
  5
  2
  2
  29
  7
   Source: Department of Education, 2015
Table 3.12.1.3 shows the level of access to sanitation services within Ugu District area of jurisdiction. What is worth noting is that all the schools do have some level of access to sanitation. However, the high percentage of pit latrines (50%) is cause for concern as per the standards of Ugu District as the VIP is the minimum acceptable sanitation standard. Table 3.12.1.4 further shows the schools’ level of access to electricity. About 90% of the schools have access to electricity through Eskom, about 5% using alternative energy and only 4% having no access at all.
Table 3.12.1.3: Access to Sanitation
 Municipality
 Flush Toilet
 VIP
 Pit Latrine
 Temporary
 Former Vulamehlo
 11
 36
 47
 1
 Umdoni
 22
 11
 20
 0
 Umzumbe
 10
 52
 117
 6
 Ray Nkonyeni
 53
 38
 66
 8
 UMuziwabantu
 10
 18
 31
 2
 Ugu
 106
 155
 281
 17
 %
  19
  28
  50
  3
   Source: Department of Education, 2015
144 UGU DISCTRICT MUNICIPALITY
