
Page 160 - UGU Dstrct Mun IDP Report '21-22
P. 160
3.8 Municipal Financial Viability and Management Analysis
Ugu District Municipality’s Constitutional Mandate of ensuring the provision of services to communities in a sustainable manner requires long term financial sustainability to support the service delivery objectives. The application of sound financial principles must ensure long term financial sustainability, strengthening of financial management systems and promotion of transparency. The multi-year budgeting method is currently being used to ensure stability. The method balances funding of capital expenditure with the impact on future operational budgets in the medium and long-term. Sound financial principles must be addressed by ensuring that compliance to legislation is maintained and policies, delegations, roles and responsibilities are properly reviewed and implemented.
3.8.1 Financial Ratios
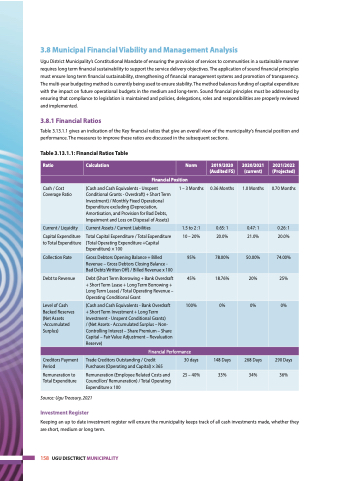
Table 3.13.1.1 gives an indication of the Key financial ratios that give an overall view of the municipality’s financial position and performance. The measures to improve these ratios are discussed in the subsequent sections.
Table 3.13.1.1: Financial Ratios Table
Ratio
Calculation
Norm
2019/2020 (Audited FS)
2020/2021 (current)
2021/2022 (Projected)
Financial Position
Cash / Cost Coverage Ratio
(Cash and Cash Equivalents - Unspent Conditional Grants - Overdraft) + Short Term Investment) / Monthly Fixed Operational Expenditure excluding (Depreciation, Amortisation, and Provision for Bad Debts, Impairment and Loss on Disposal of Assets)
1 – 3 Months
0.36 Months
1.0 Months
0.70 Months
Current / Liquidity
Current Assets / Current Liabilities
1.5 to 2 :1
0.65: 1
0.47: 1
0.26: 1
Capital Expenditure to Total Expenditure
Total Capital Expenditure / Total Expenditure (Total Operating Expenditure +Capital Expenditure) × 100
10 – 20%
20.0%
21.0%
20.0%
Collection Rate
Gross Debtors Opening Balance + Billed Revenue – Gross Debtors Closing Balance - Bad Debts Written Off ) / Billed Revenue x 100
95%
78.00%
50.00%
74.00%
Debt to Revenue
Debt (Short Term Borrowing + Bank Overdraft + Short Term Lease + Long Term Borrowing + Long Term Lease) / Total Operating Revenue – Operating Conditional Grant
45%
18.76%
20%
25%
Level of Cash Backed Reserves (Net Assets -Accumulated Surplus)
(Cash and Cash Equivalents - Bank Overdraft + Short Term Investment + Long Term Investment - Unspent Conditional Grants)
/ (Net Assets - Accumulated Surplus – Non- Controlling Interest – Share Premium – Share Capital – Fair Value Adjustment – Revaluation Reserve)
100%
0%
0%
0%
Financial Performance
Creditors Payment Period
Trade Creditors Outstanding / Credit Purchases (Operating and Capital) × 365
30 days
148 Days
268 Days
290 Days
Remuneration to Total Expenditure
Remuneration (Employee Related Costs and Councillors’ Remuneration) / Total Operating Expenditure x 100
25 – 40%
33%
34%
36%
Source: Ugu Treasury, 2021
Investment Register
Keeping an up to date investment register will ensure the municipality keeps track of all cash investments made, whether they are short, medium or long term.
158 UGU DISCTRICT MUNICIPALITY
