
Page 161 - UGU Dstrct Mun IDP Report '21-22
P. 161
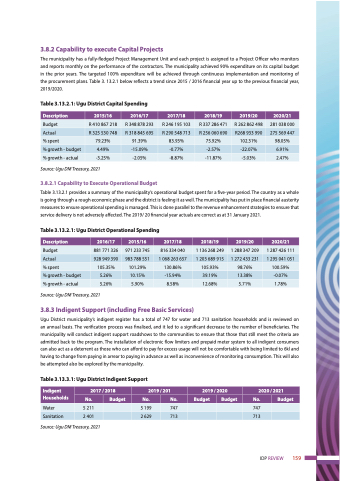
 3.8.2 Capability to execute Capital Projects
The municipality has a fully-fledged Project Management Unit and each project is assigned to a Project Officer who monitors and reports monthly on the performance of the contractors. The municipality achieved 90% expenditure on its capital budget in the prior years. The targeted 100% expenditure will be achieved through continuous implementation and monitoring of the procurement plans. Table 3. 13.2.1 below reflects a trend since 2015 / 2016 financial year up to the previous financial year, 2019/2020.
Table 3.13.2.1: Ugu District Capital Spending
Source: Ugu DM Treasury, 2021
3.8.2.1 Capability to Execute Operational Budget
Table 3.13.2.1 provides a summary of the municipality’s operational budget spent for a five-year period. The country as a whole is going through a rough economic phase and the district is feeling it as well. The municipality has put in place financial austerity measures to ensure operational spending is managed. This is done parallel to the revenue enhancement strategies to ensure that service delivery is not adversely affected. The 2019/ 20 financial year actuals are correct as at 31 January 2021.
Table 3.13.2.1: Ugu District Operational Spending
Source: Ugu DM Treasury, 2021
3.8.3 Indigent Support (including Free Basic Services)
Ugu District municipality’s indigent register has a total of 747 for water and 713 sanitation households and is reviewed on an annual basis. The verification process was finalised, and it led to a significant decrease to the number of beneficiaries. The municipality will conduct indigent support roadshows to the communities to ensure that those that still meet the criteria are admitted back to the program. The installation of electronic flow limiters and prepaid meter system to all indigent consumers can also act as a deterrent as those who can afford to pay for excess usage will not be comfortable with being limited to 6kl and having to change from paying in arrear to paying in advance as well as inconvenience of monitoring consumption. This will also be attempted also be explored by the municipality.
Table 3.13.3.1: Ugu District Indigent Support
Source: Ugu DM Treasury, 2021
 Description
 2015/16
 2016/17
 2017/18
 2018/19
 2019/20
 2020/21
 Budget
 R 410 867 218
 R 348 878 293
 R 246 195 103
 R 337 286 471
 R 262 862 498
 281 038 000
 Actual
 R 325 530 748
 R 318 845 695
 R 290 548 713
 R 256 060 690
 R268 933 990
 275 569 447
 % spent
 79.23%
 91.39%
 83.93%
 75.92%
 102.31%
 98.05%
 % growth - budget
 4.49%
 -15.09%
 -0.77%
 -2.57%
 -22.07%
 6.91%
 % growth - actual
  -3.25%
  -2.05%
  -8.87%
  -11.87%
  -5.03%
  2.47%
    Description
 2016/17
 2015/16
 2017/18
 2018/19
 2019/20
 2020/21
 Budget
 881 771 326
 971 233 745
 816 334 040
 1 136 268 249
 1 288 347 209
 1 287 426 111
 Actual
 928 949 390
 983 788 551
 1 068 263 657
 1 203 689 915
 1 272 433 231
 1 295 041 051
 % spent
 105.35%
 101.29%
 130.86%
 105.93%
 98.76%
 100.59%
 % growth - budget
 5.26%
 10.15%
 -15.94%
 39.19%
 13.38%
 -0.07%
 % growth - actual
  5.26%
  5.90%
  8.58%
  12.68%
  5.71%
  1.78%
    Indigent Households
 2017 / 2018
 2019 / 201
 2019 / 2020
 2020 / 2021
 No.
 Budget
 No.
 No.
 Budget
 Budget
 No.
 Budget
 Water
 5 211
  5 199
 747
   747
  Sanitation
  2 401
    2 629
  713
      713
      IDP REVIEW 159
