
Page 71 - UGU Dstrct Mun IDP Report '21-22
P. 71
ownership of land, and environmental degradation across the district. municipality’s area of jurisdiction based on the parent municipality’s integrated development plan and policies pertaining to this objective thereby unlocking the economic potential of the Hibiscus Coast area. With focus being on the economic, social and environmental development.
3.4.4 Organisational Analysis
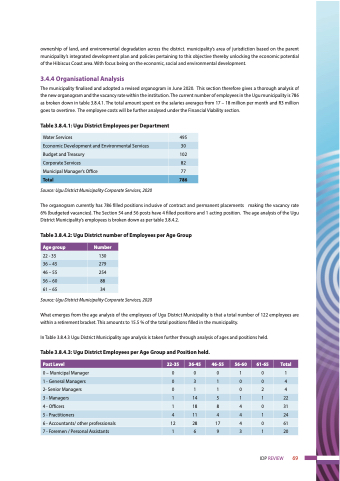
The municipality finalised and adopted a revised organogram in June 2020. This section therefore gives a thorough analysis of the new organogram and the vacancy rate within the institution. The current number of employees in the Ugu municipality is 786 as broken down in table 3.8.4.1. The total amount spent on the salaries averages from 17 – 18 million per month and R3 million goes to overtime. The employee costs will be further analysed under the Financial Viability section.
Table 3.8.4.1: Ugu District Employees per Department
Source: Ugu District Municipality Corporate Services, 2020
The organogram currently has 786 filled positions inclusive of contract and permanent placements making the vacancy rate 6% (budgeted vacancies). The Section 54 and 56 posts have 4 filled positions and 1 acting position. The age analysis of the Ugu District Municipality’s employees is broken down as per table 3.8.4.2.
Table 3.8.4.2: Ugu District number of Employees per Age Group
Source: Ugu District Municipality Corporate Services, 2020
What emerges from the age analysis of the employees of Ugu District Municipality is that a total number of 122 employees are within a retirement bracket. This amounts to 15.5 % of the total positions filled in the municipality.
In Table 3.8.4.3 Ugu District Municipality age analysis is taken further through analysis of ages and positions held.
Table 3.8.4.3: Ugu District Employees per Age Group and Position held.
Water Services
495
Economic Development and Environmental Services
30
Budget and Treasury
102
Corporate Services
82
Municipal Manager’s Office
77
Total
786
Age group
Number
22 - 35
130
36 – 45
279
46 – 55
254
56 – 60
88
61 – 65
34
Post Level
22-35
36-45
46-55
56-60
61-65
Total
0 – Municipal Manager
0
0
0
1
0
1
1 - General Managers
0
3
1
0
0
4
2- Senior Managers
0
1
1
0
2
4
3 - Managers
1
14
5
1
1
22
4 - Officers
1
18
8
4
0
31
5 - Practitioners
4
11
4
4
1
24
6 - Accountants/ other professionals
12
28
17
4
0
61
7 - Foremen / Personal Assistants
1
6
9
3
1
20
IDP REVIEW 69
