
Page 79 - UGU Dstrct Mun IDP Report '21-22
P. 79
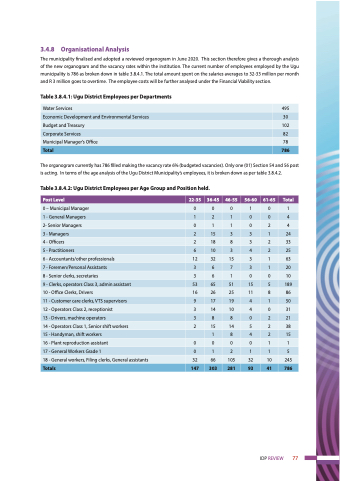
 3.4.8 Organisational Analysis
The municipality finalised and adopted a reviewed organogram in June 2020. This section therefore gives a thorough analysis of the new organogram and the vacancy rates within the institution. The current number of employees employed by the Ugu municipality is 786 as broken down in table 3.8.4.1. The total amount spent on the salaries averages to 32-33 million per month and R 3 million goes to overtime. The employee costs will be further analysed under the Financial Viability section.
Table 3.8.4.1: Ugu District Employees per Departments
The organogram currently has 786 filled making the vacancy rate 6% (budgeted vacancies). Only one (01) Section 54 and 56 post is acting. In terms of the age analysis of the Ugu District Municipality’s employees, it is broken down as per table 3.8.4.2.
Table 3.8.4.2: Ugu District Employees per Age Group and Position held.
 Water Services
 495
 Economic Development and Environmental Services
 30
 Budget and Treasury
 102
 Corporate Services
 82
 Municipal Manager’s Office
 78
 Total
  786
    Post Level
 22-35
 36-45
 46-55
 56-60
 61-65
 Total
 0 – Municipal Manager
 0
 0
 0
 1
 0
 1
 1 - General Managers
 1
 2
 1
 0
 0
 4
 2- Senior Managers
 0
 1
 1
 0
 2
 4
 3 - Managers
 2
 15
 3
 3
 1
 24
 4 - Officers
 2
 18
 8
 3
 2
 33
 5 - Practitioners
 6
 10
 3
 4
 2
 25
 6 - Accountants/other professionals
 12
 32
 15
 3
 1
 63
 7 - Foremen/Personal Assistants
 3
 6
 7
 3
 1
 20
 8 - Senior clerks, secretaries
 3
 6
 1
 0
 0
 10
 9 - Clerks, operators Class 3, admin assistant
 53
 65
 51
 15
 5
 189
 10 - Office Clerks, Drivers
 16
 26
 25
 11
 8
 86
 11 - Customer care clerks, VTS supervisors
 9
 17
 19
 4
 1
 50
 12 - Operators Class 2, receptionist
 3
 14
 10
 4
 0
 31
 13 - Drivers, machine operators
 3
 8
 8
 0
 2
 21
 14 - Operators Class 1, Senior shift workers
 2
 15
 14
 5
 2
 38
 15 - Handyman, shift workers
  1
 8
 4
 2
 15
 16 - Plant reproduction assistant
 0
 0
 0
 0
 1
 1
 17 - General Workers Grade 1
 0
 1
 2
 1
 1
 5
 18 - General workers, Filing clerks, General assistants
 32
 66
 105
 32
 10
 245
 Totals
  147
  303
  281
  93
  41
  786
    IDP REVIEW 77
