
Page 91 - UGU Dstrct Mun IDP Report '21-22
P. 91
is done via more than 42 000 private household connections and over 5 000 communal stand taps which mainly service the inland rural areas. The demographics of the Ugu district vary from dense formal urban settlements to scattered rural settlements and must be dealt with differently when planning for the provision of water services. Different levels of service are appropriate for each settlement category and the new Norms and Standards has been used to determine the water demands for each area. The new Norms and Standards prescribes a minimum of 75 l/p/d as the minimum standard. The maximum being around 200 l/p/d. This has resulted in much higher future water demands. All systems require upgrade to be able to supply the future demands.
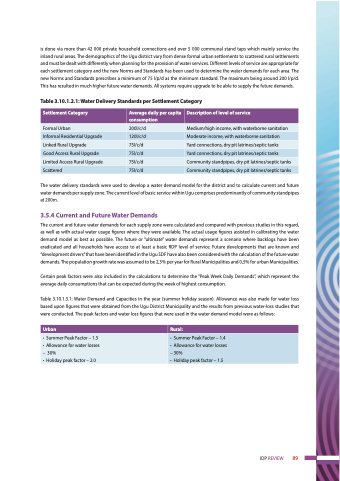
Table 3.10.1.2.1: Water Delivery Standards per Settlement Category
Settlement Category
Average daily per capita consumption
Description of level of service
Formal Urban
200l/c/d
Medium/high income, with waterborne sanitation
Informal Residential Upgrade
120l/c/d
Moderate income, with waterborne sanitation
Linked Rural Upgrade
75l/c/d
Yard connections, dry pit latrines/septic tanks
Good Access Rural Upgrade
75l/c/d
Yard connections, dry pit latrines/septic tanks
Limited Access Rural Upgrade
75l/c/d
Community standpipes, dry pit latrines/septic tanks
Scattered
75l/c/d
Community standpipes, dry pit latrines/septic tanks
The water delivery standards were used to develop a water demand model for the district and to calculate current and future water demands per supply zone. The current level of basic service within Ugu comprises predominantly of community standpipes at 200m.
3.5.4 Current and Future Water Demands
The current and future water demands for each supply zone were calculated and compared with previous studies in this regard, as well as with actual water usage figures where they were available. The actual usage figures assisted in calibrating the water demand model as best as possible. The future or “ultimate” water demands represent a scenario where backlogs have been eradicated and all households have access to at least a basic RDP level of service. Future developments that are known and “development drivers” that have been identified in the Ugu SDF have also been considered with the calculation of the future water demands. The population growth rate was assumed to be 2,3% per year for Rural Municipalities and 0,5% for urban Municipalities.
Certain peak factors were also included in the calculations to determine the “Peak Week Daily Demands”, which represent the average daily consumptions that can be expected during the week of highest consumption.
Table 3.10.1.3.1: Water Demand and Capacities in the year (summer holiday season). Allowance was also made for water loss based upon figures that were obtained from the Ugu District Municipality and the results from previous water-loss studies that were conducted. The peak factors and water loss figures that were used in the water demand model were as follows:
Urban
Rural:
• Summer Peak Factor – 1.3 • Allowance for water losses – 30%
• Holiday peak factor – 2.0
• Summer Peak Factor – 1.4 • Allowance for water losses – 30%
• Holiday peak factor – 1.5
IDP REVIEW 89
