
Page 64 - DUT Annual Report 2023
P. 64
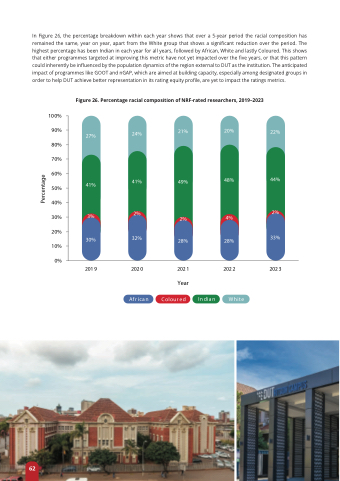
In Figure 26, the percentage breakdown within each year shows that over a 5-year period the racial composition has remained the same, year on year, apart from the White group that shows a significant reduction over the period. The highest percentage has been Indian in each year for all years, followed by African, White and lastly Coloured. This shows that either programmes targeted at improving this metric have not yet impacted over the five years, or that this pattern could inherently be influenced by the population dynamics of the region external to DUT as the institution. The anticipated impact of programmes like GOOT and nGAP, which are aimed at building capacity, especially among designated groups in order to help DUT achieve better representation in its rating equity profile, are yet to impact the ratings metrics.
Figure 26. Percentage racial composition of NRF-rated researchers, 2019–2023
                                                                                                                                                                                            62
